Published Date 12/3/18 4:27 PM
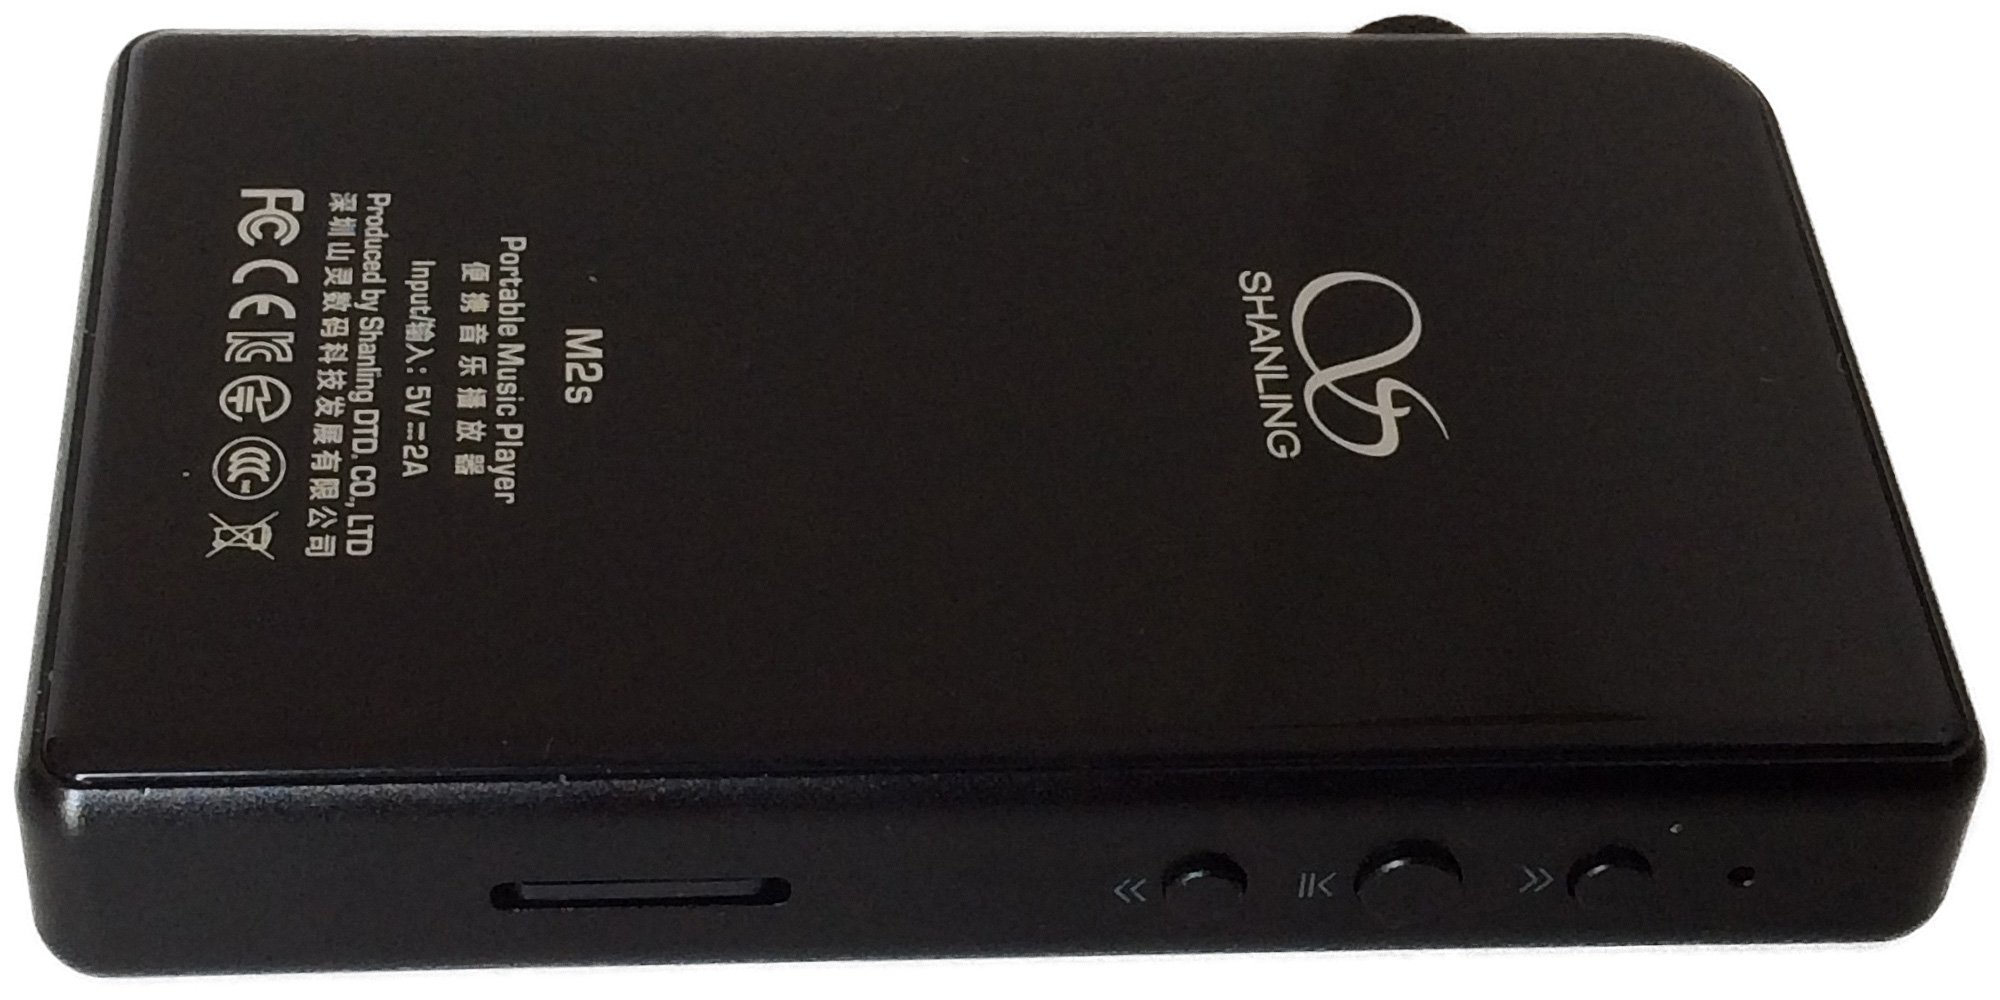
Figure 1: Portable player M2s kindly offered for testing by Alexey Silich.
| Thanks to Alexey we start our collection of tested devices with portable music player M2s by Shanling Audio. Overview of the player with technical specifications can be found on the manufacturer's website → M2s portable music player. We performed standard df-measurements with technical signals and real music material. The player has two settings which have unclear impact on perceived sound quality: - Gain Setting: Low / High
- Lopass filter mode: steep / gradual
In order to find out that, M2s was tested in three modes: - All-off: Low Gain - steep lowpass filter
- HighGain: High Gain - steep lowpass filter
- gradual: Low Gain - gradual lowpass filter
The following three df-slides show level of waveform degradation in these modes. The most meaningful value on df-slide is histogram median, which is assumed to correlate well to perceived sound quality (the research is still in progress). The less the value, the higher playback fidelity. | 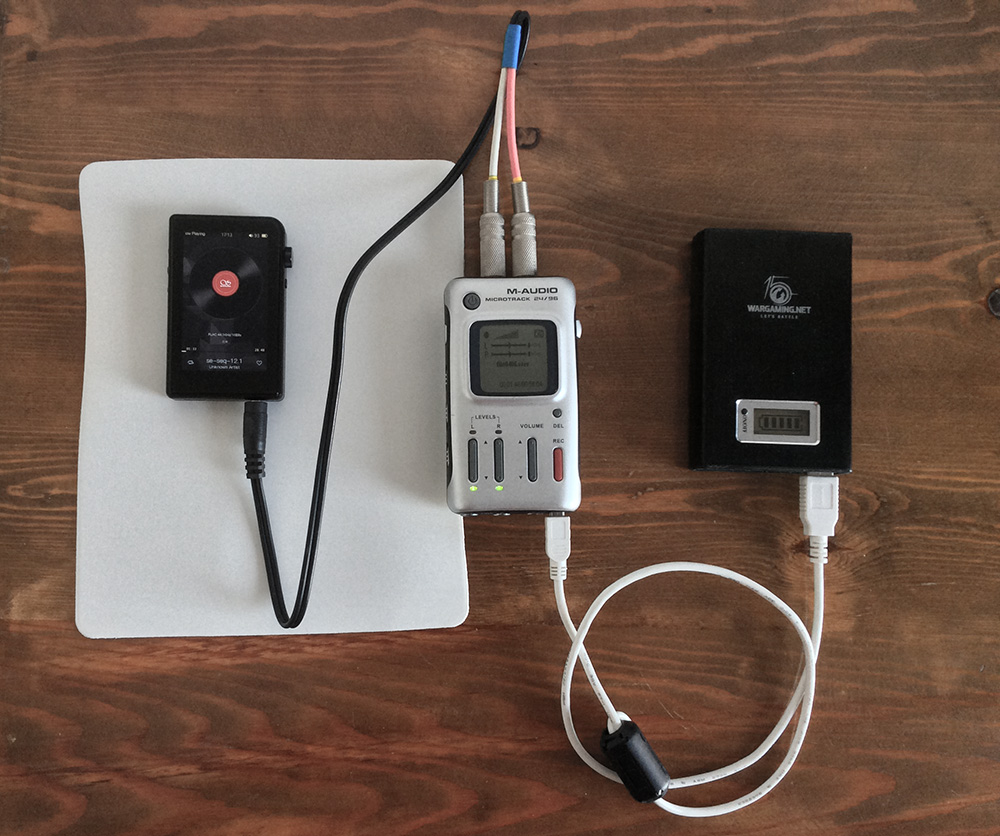 Figure 2: Recording of SE test sequences from headphone jack of M2s portable player. |
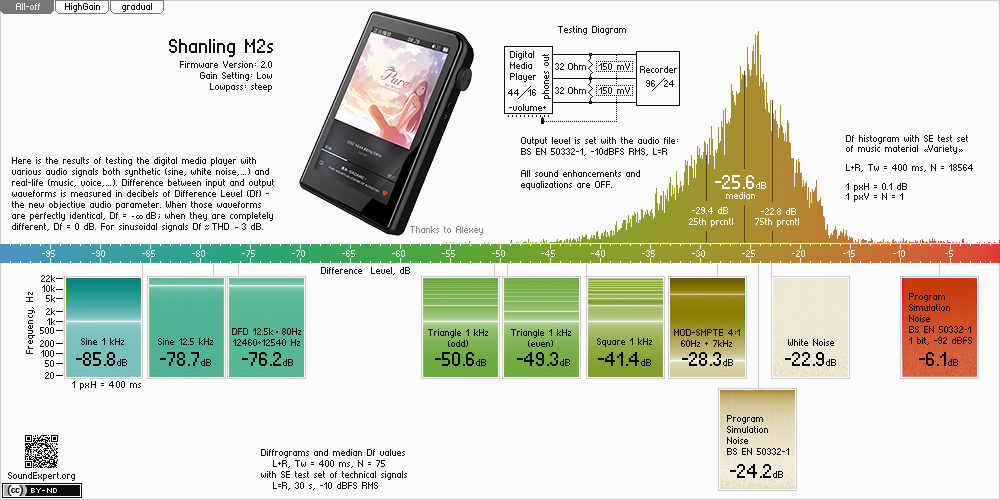
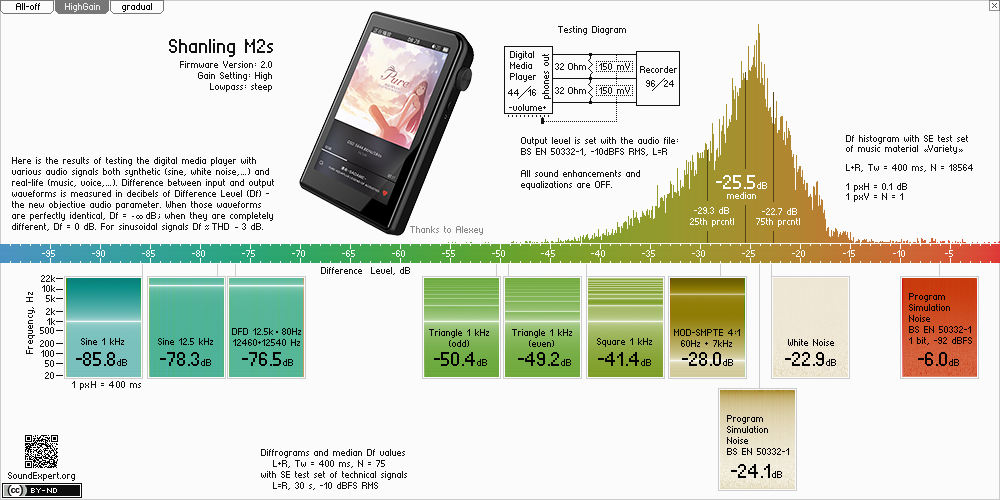
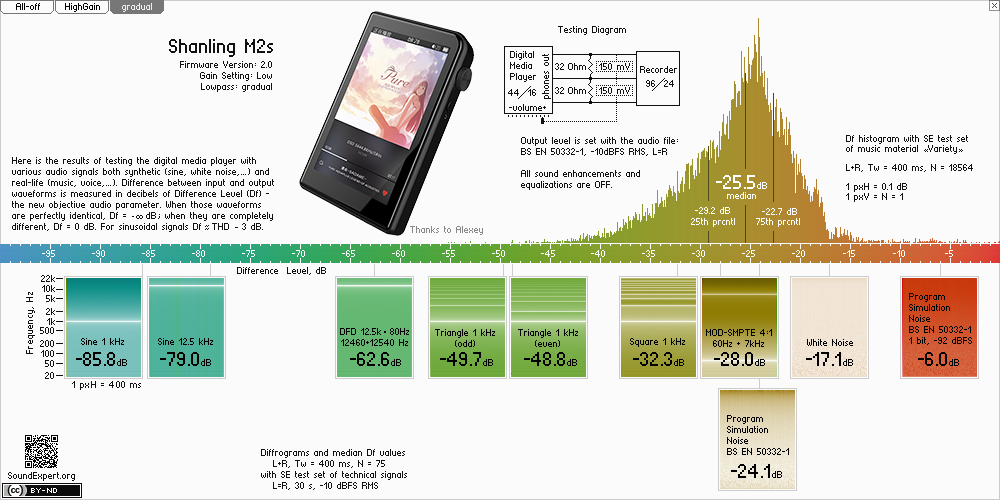
Df-slides are self-explanatory, additional detailes are here → How to read df-slides.
Conclusions from the above df-slides:
(1) Low and High Gain modes are almost identical, you will not hear any difference between them with 32 Ohm headphones. High Gain mode can be useful only for high impedance and/or low sensitivity headphones.
(2) Sine 1kHz signal is reproduced with high (and the same) accuracy in all modes. The Difference level -85.8 dB is equivalent to THD+N 0.007% (non-weighting). This is the best Df value for Sine 1kHz signal among portable players we've tested so far.
(3) In all modes Sine 12.5kHz signal is reproduced with substantially lower accuracy (Figure 3).
 | Figure 3: Diffrogram of the 1kHz Sine signal reproduced by Shanling M2s player (x4 zoom). The time window of Df calculations Tw = 400ms, median Df = -78.7dB. Vertical stripes of different color correspond to the portions of signal (400ms) that degraded higher during playback. Instability of clock generator and low quality oversampling are usual causes of such periodic degradation. |
If we repeat this measurement with the shorter time window (50ms) the issue almost disappears because the window is substantially shorter than the period of fluctuations (~1.5s).
 | Figure 4: The diffrogram from Fig.1 computed using shorter time window. Tw = 50ms, median Df = -85.0 dB. The periodic degradation of the signal is almost not noticeable. |
Such time inaccuracy may potentially cause the sound quality degradation - loss of clarity in high frequency range; may be to some non-significant extent, though. But ... majority of other portable players on the market including smartphones do not have such issue, why here?
(4) In gradual lowpass filter mode (and Low Gain) :
- the music material is reproduced with the same overall difference level - the histogram is almost exactly the same as in steep lowpass filter mode
- one tech. signal (sine 12.5kHz) is reproduced with higher accuracy (0.3dB increase)
- one tech. signal (sine 1kHz) is not affected by the setting
- eight tech. signals are reproduced with lower accuracy (square, both triangles, MOD-SMPTE, both BS EN 50332-1, white noise, DFD; the latter looses 13.6dB)
From the above we can safely conclude that
- the difference between steep and gradual settings is hardly noticeable by human ear
- in steep mode accuracy of reproduction increases for majority of signals, so steep mode should be preferred.
In the end, the portable player Shanling M2s (with firmware 2.0 and 44/16 music material) provides roughly the same audio quality as Apple iPhones 4/5/6, not better. Unfortunately there is no possibility to repeat the tests with the latest firmware (3.50) as the player has been already returned to the owner. But the firmware change logs since v2.0 do not mention any improvements related to the issue (3).
Df-slides of all tested players can be easily compared with each other on the Portable Players page. The page also has simple overview of the measurement procedure and metric.
Appendix
1. Diffrograms of 35 tracks of the test set “Variety” in three testing modes. They show level of waveform degradation of the musical signal divided into 400ms chunks (one pixel each). Median Df values of the tracks are indicated. Click a track to open in full size for quick comparison with similar tracks from another setting/device. For example last 8s of the track #34 (Darkside - (2013) Psychic - Paper Trails) has slightly different color for steep and gradual filter modes. Which means that in steep mode ("greener" color) this portion of the track is reproduced with higher accuracy. More about diffrograms → Diffrogram: visualization of signal differences in audio research.
All-off | 1 | 2 | 3 | 4 | 5 | 6 | 7 | 8 | 9 | 10 | 11 | 12 | 13 | 14 | 15 | 16 | 17 | 18 | 19 | 20 | 21 | 22 | 23 | 24 | 25 | 26 | 27 | 28 | 29 | 30 | 31 | 32 | 33 | 34 | 35 |
__ref1.wav(44)__mono_400-38.3020-28.5504-0.0842.png) |  |  |  |  |  |  |  |  |  |  |  |  |  |  |  |  |  |  |  |  |  |  |  |  |  |  |  |  |  |  |  |  |  |  |
| -28.6 | -24.3 | -23.8 | -31.5 | -24.9 | -25.6 | -30.5 | -24.4 | -22.3 | -22.4 | -28.3 | -23.7 | -26.5 | -26.1 | -33.6 | -26.1 | -32.4 | -24.6 | -31.6 | -37.0 | -30.0 | -22.3 | -25.6 | -19.7 | -26.5 | -25.2 | -22.2 | -19.0 | -24.9 | -25.2 | -24.9 | -19.1 | -32.4 | -25.3 | -27.8 |
HighGain | 1 | 2 | 3 | 4 | 5 | 6 | 7 | 8 | 9 | 10 | 11 | 12 | 13 | 14 | 15 | 16 | 17 | 18 | 19 | 20 | 21 | 22 | 23 | 24 | 25 | 26 | 27 | 28 | 29 | 30 | 31 | 32 | 33 | 34 | 35 |
 |  |  |  |  |  |  |  |  |  |  |  |  |  |  |  |  |  |  |  |  |  |  |  |  |  |  |  |  |  |  |  |  |  |  |
| -28.4 | -24.2 | -23.7 | -31.4 | -24.8 | -25.5 | -30.4 | -24.4 | -22.3 | -22.4 | -28.2 | -23.6 | -26.4 | -26.0 | -33.6 | -26.0 | -32.3 | -24.5 | -31.5 | -36.9 | -29.8 | -22.2 | -25.5 | -19.6 | -26.4 | -25.1 | -22.1 | -18.9 | -24.8 | -25.1 | -24.8 | -19.1 | -32.3 | -25.2 | -27.8 |
gradual | 1 | 2 | 3 | 4 | 5 | 6 | 7 | 8 | 9 | 10 | 11 | 12 | 13 | 14 | 15 | 16 | 17 | 18 | 19 | 20 | 21 | 22 | 23 | 24 | 25 | 26 | 27 | 28 | 29 | 30 | 31 | 32 | 33 | 34 | 35 |
 |  |  |  |  |  |  |  |  |  |  |  |  |  |  |  |  |  |  |  |  |  |  |  |  |  |  |  |  |  |  |  |  |  |  |
| -28.5 | -24.2 | -23.7 | -31.4 | -24.8 | -25.5 | -30.4 | -24.3 | -22.3 | -22.4 | -28.2 | -23.5 | -26.1 | -26.0 | -33.6 | -25.9 | -32.2 | -24.5 | -31.5 | -36.9 | -29.9 | -22.2 | -25.5 | -19.6 | -26.4 | -25.1 | -22.2 | -18.9 | -24.8 | -25.1 | -24.8 | -19.1 | -32.3 | -24.9 | -27.8 |
2. Dendrogram of similarity of artifact signatures for the portable players.
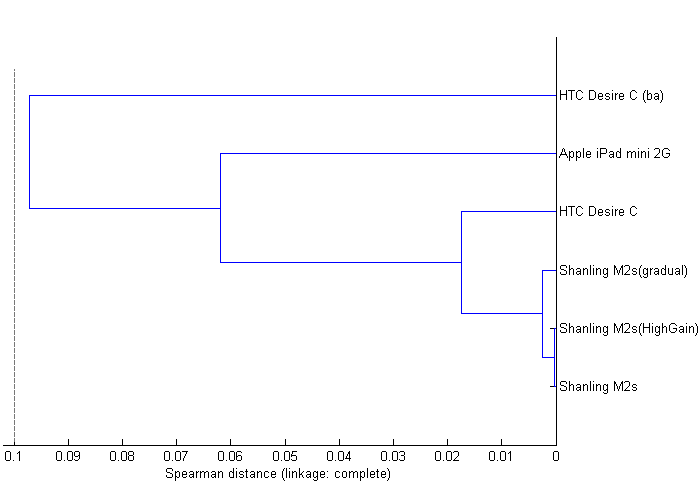 | Figure 5: Dendrogram showing similarity of artifact signatures of tested players. The shorter the link between two players, the more similar their artifact signatures. The Spearman distance = 0.1 is critical for relation of Df measurements to subjective scores. For the players which have similar artifact signatures (distance < 0.1) their perceived sound quality estimations correlate well to df-measurements, computed with real-life music material (histogram medians). |