Almost six years have passed since the last SE article about bluetooth (BT) audio. It's time to return to the topic following some developments in the field. Even a few years ago it was clear that BT is capable of delivering high quality audio. SE listening tests showed that mandatory audio codec SBC for BT A2DP profile is not bad at all. In “High Quality” mode (@328kbit/s) it is on a par with ATRAC SP (Type-R, @292kbit/s) compression algorithm which is used in Minidisc recorders/players. In “Middle Quality” mode (@229kbit/s) it is roughly comparable with mp3@128kbit/s or aac@96kbit/s. At max possible bitrate 372kbit/s SBC codec is comparable with aac@192kbit/s and most artifacts it produces are beyond human perception. Close positioning of the two codecs – SBC (High Quality) and ATRAC SP (Type-R) – on perceptual quality scale is revealing. Recordings made on Minidisk equipment with ATRAC SP were considered to be of high fidelity by most demanding listeners. It is an example of combination of barely acceptable audio codec with perfectly designed audio circuits. As opposed to ATRAC equipment, early BT A2DP devices, having on board the commensurable audio codec SBC, performed poorly just because their audio circuitry was of simplistic design. In other words BT audio potential was not fully utilized.
At the same time the demand for high quality BT audio was high, because this technology has some clear benefits for consumers:
- absence of wires, obviously
- audio quality of such devices are fully determined by receiving side. For example BT headphones can sound exactly the same with different sources of signal – phones/players, tablets, laptops etc., which are just sources of standard digital stream in this scenario.
So, it was clear that sooner or later somebody will hammer all those BT audio drawbacks and will offer a more matured solution for demanding listeners. Finally UK based semiconductor company CSR, which already had experience in developing and manufacturing of BT chips, did this. In particular the company:
- developed new BT chips with carefully designed audio circuits
- added its propriatery audio codec aptX (acquired with APT Licensing Ltd in 2010) in addition to mandatory SBC codec
- implemented more strict control over manufacturers who use CSR BT solutions in their products
As it was shown above the problem of poor BT audio could be solved by taking measures (1) and (3) alone. Improvement in codec efficiency is just an accessory plus. The more so as such improvement is hard to achieve due to tough conditions for any BT audio codec:
- low complexity of algorithm (to constrain energy consumption)
- low encoding-decoding delay (for better video and gaming experience)
- limited bandwidth of A2DP profile (max. 721kbit/s, less in real-life scenarios)
But no matter what was behind the CSR decision to use some other codec in addition to mandatory and pretty acceptable SBC, the choice of aptX looks logical from audio quality perspective. This family of codecs are successfully used in professional audio since 1990s thanks to their low complexity and absence of psychoacoustic masking. This results in low delay and stable/predictive perceptual quality with various audio material. CSR uses in their BT chips aptX codec with the following parameters (specs by CSR):
- Compression ratio: 4:1
- Audio Format: 16-bit, 44.1kHz
- Data Rates: 352kbps
- Frequency Response: 10Hz to 22kHz
- Algorithmic Delay: <1.89ms @ Fs 48KHz
- Dynamic Range: 16-bit: >92dB
- THD+N: -68.8dB
August 2018
Starting from version 4.0 A/V processor ffmpeg has encoding/decoding capabilities for aptX and aptX HD formats. The same codecs are also available as separate command line utilities openaptxenc and openaptxdec.
Both codecs were added to SE engine for blind testing:
aptX CBR@352.8 (Bluetooth) - Codec for Bluetooth A2DP profile, CBR, 352.8 kbit/s FBR
CODER: ffmpeg 4.0.2 (Lavc58.18.100 aptx)
- usage: ffmpeg -i ref.wav -acodec aptx out.aptx
- 44100 Hz, 16bit
DECODER: ffmpeg 4.0.2 (Lavc58.18.100 pcm_s16le)
- usage: ffmpeg -sample_rate 44100 -i out.aptx out.wav
aptX HD CBR@529.2 (Bluetooth) - Codec for Bluetooth A2DP profile, CBR, 529.2 kbit/s FBR
CODER: ffmpeg 4.0.2 (Lavc58.18.100 aptx_hd)
- usage: ffmpeg -i ref.wav -acodec aptx_hd out.aptxhd
- 44100 Hz, 16bit
DECODER: ffmpeg 4.0.2 (Lavc58.18.100 pcm_s16le)
- usage: ffmpeg -sample_rate 44100 -i out.aptxhd out.wav
Their results (inaccurate so far) are available on the page Encoders 320+ kbit/s. For those who would like to participate in SE listening tests there is a short instruction on that page below the ratings.
Objective measurements of aptX and aptX HD using music based df-metric
Usually objective measurements of audio encoders are considered as incorrect method for judging their audio quality. This is true and can be explained in simple words as follows. The encoders process different parts of complex audio signal differently according to some rules specific to each particular encoder. So, measurements performed with some technical signals say almost nothing about encoder's behavior with real-life audio material.
Part of this problem can be solved by using music/voice as a test signal. For the purpose special algorithm was developed. It compares two waveforms and computes level of difference between them. The algorithm is smart enough not to account basic amplitude, pitch and phase distortions, if any, as they don't affect perceived sound quality. Resulting audio parameter is called Difference Level (Df,dB); it shows how different two "canonical" waveforms are. If they are perfectly identical, Df = -∞ dB; if they are completely different, Df = 0 dB.
Preliminary research showed that in some cases (those, which met definite conditions) such objective measurements, performed using substantial amount of real-life audio material, correlate well to subjective estimations of sound quality. And though the research is still in progress I decided to publish results of such measurements as they look interesting and promising enough. Those who are not interested in scientific details can scroll to the end of the article for conclusions.
Measurements of Bluetooth audio codecs were performed using Pink Floyd album "The Dark Side Of The Moon" as a test signal. Output waveforms of the codecs were compared with the reference waveform piece-wise (400ms). Thus, the measurement algorithm computed for each codec a sequence of 6430 Df values. The sequence shows to what extent different parts of the test signal were distorted by each particular codec. Figure 1 shows histograms of those sequences with medians and 25/75 percentiles indicated.
aptX and aptX HD encoding/decoding was performed using ffmpeg utility with settings mentioned above in the article. For SBC encoding/decoding the reference SBC codec was used - SBC Encoder LIB Version 1.5 (Philips). This mandatory BT codec was measured in three quality modes:
- @201 kbit/s - Low Quality
- @229 kbit/s - Middle Quality
- @328 kbit/s - High Quality
and two methods of bits allocation:
Command lines used for SBC encoding:
sbc_encoder.exe -jv -p -r328000 -oout.sbc ref.wav - SBC@328 with Loudness bits allocation
sbc_encoder.exe -jv -r328000 -oout.sbc ref.wav - SBC@328 with SNR bits allocation (SNR is default for the encoder)
For better understanding of this measurement method two other codecs were added to the test:
- IMA ADPCM 4:1 @354 kbit/s - close relative to our codecs under test
- AAC @256 kbit/s (iTunes Plus) - a very different codec
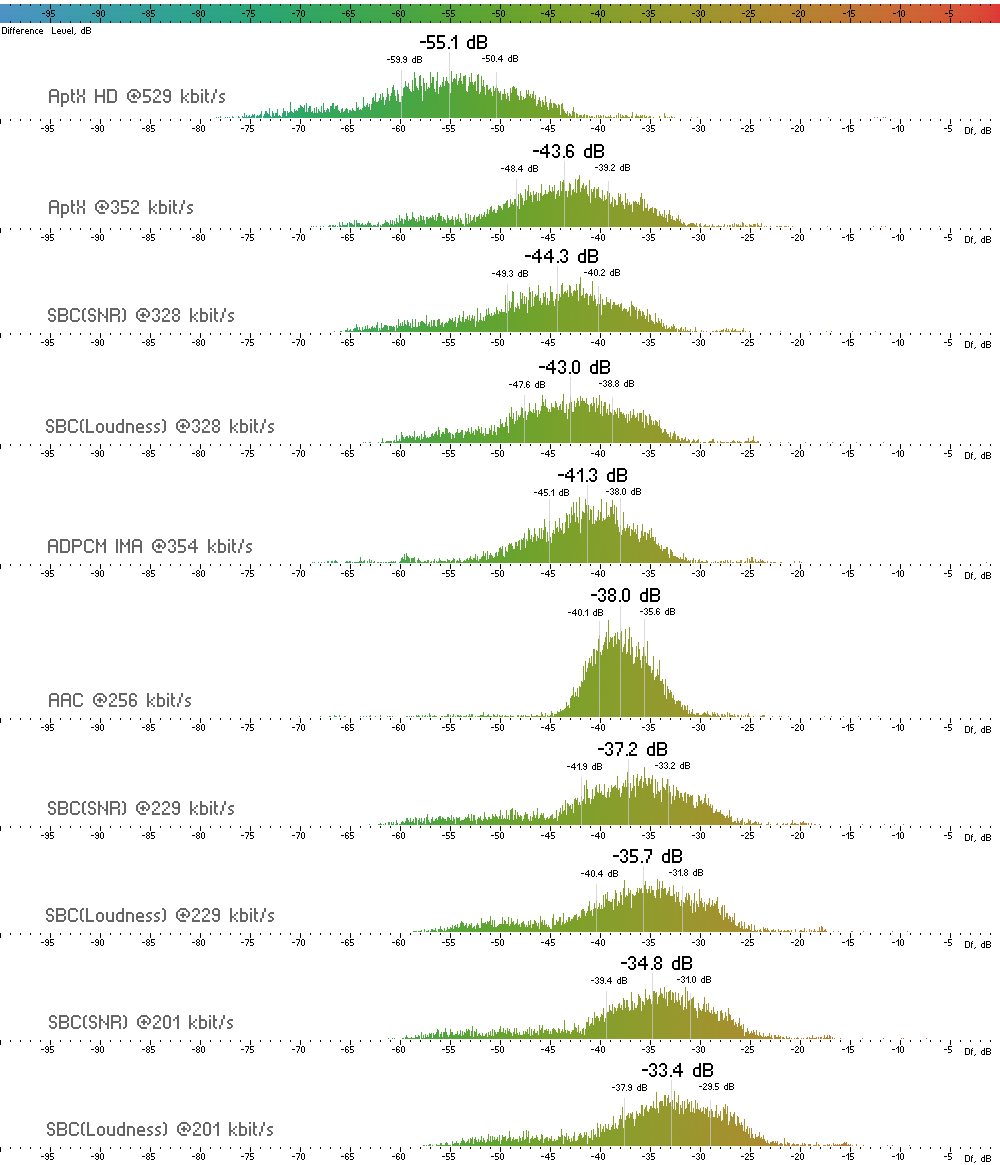
Figure 1. Histograms of df-sequences for the codecs under test. Medians are estimators of average waveform degradation. Shape of histograms relates to character/type of waveform degradation.
There is a strong temptation to conclude from the above figure that scores of perceived sound quality for the codecs will follow the medians of their histograms. Unfortunately the relation is not so simple. The medians show only the amount of waveform degradation but they say nothing about character of that degradation. As in standard audio metric - not all distortions are equal from listener's perspective. Df measurements are good indicators of sound quality only in cases where types of waveform degradation are similar. In other words, if artifact signatures are similar within a group of devices under test, then their measurements of waveform degradation correlate well to perceived sound quality estimations.
So, we need a measure of artifacts' similarity. Some basic idea about similarity of the codecs can be derived from the shapes of their histograms. While SBC and aptX histograms are quite similar, ADPCM and especially AAC ones look different. But for sure we need more defined method for similarity estimation. As for each codec we have a long sequence of Df values, not a single median, and such sequence shows in great detail what parts of the signal were degraded to what extent, this sequence can be safely considered as an artifact signature of the codec. Comparing such signatures we can determine a group of codecs with similar artifacts. In mathematics such tasks are solved using methods of cluster analysis. In order to use it in our case we should find some measure of distance between df-sequences which will serve as a measure of similarity between them. Multiple experiments with various devices under test revealed that Distance Correlation (Gábor J. Székely, 2005) works best as a measure of distance in our case (Spearman's rank correlation is the second). Dendrogram on Figure 2 shows resulting distances between our df-sequences.
| 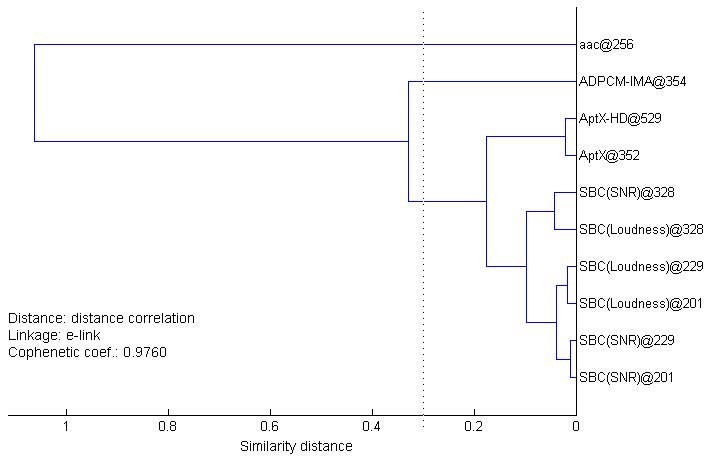 | Figure 2. Dendrogram showing similarity of codecs. The shorter the link between two codecs, the more similar their artifact signatures. The distance value 0.3 is critical for relation of Df measurements to subjective scores. |
Here we can see how distances between codecs gradually increase from SBC to aptX, ADPCM, AAC. Previous experiments with various codecs showed that for distances greater than 0.3 the relation of Df measurements to subjective scores starts to degrade rapidly. This is the point of uncertainty. Below it the relation holds. So, audio quality of SBC and both aptX codecs can be safely judged by their Df measurements (medians); ADPCM codec is slightly above the point of uncertainty and its quality can be assessed in our case with greater error only; nothing can be said about audio quality of AAC, its artifact signature differs greatly from the ones of other codecs in our set.
Now, we can return to Figure 1 and make some conclusions.
(1) aptX codec used in BT applications is no better than SBC@328. Despite slightly lower algorithmic delay of aptX both SBC and aptX codecs provide the same 100-150ms latency in real-life BT applications. If you hear the difference between SBC and aptX in some BT product, there can be only two explanations - placebo effect or using SBC in Middle or Low Quality modes. It's pretty clear now that aptX was necessary to CSR as a key element of its marketing strategy aimed at effective selling of new CSR BT chips/solutions to manufacturers (with license fees) which in turn effectively sell their "innovative" BT products to consumers. AptX is just a copperless overpriced audio cable. Audio industry at its best.
(2) aptX HD is high-bitrate version of aptX. It has clearly noticeable increase in sound quality (not dramatic though taking into account the increase in bitrate)
(3) Carefully designed headphones (or speakers) with SBC on board and indicator of quality mode will satisfy 99% of listeners and will be compatible with all BT audio sources on the market.
Update 2019.06
New article “Audio quality of SBC XQ Bluetooth audio codec” is available - http://soundexpert.org/articles/-/blogs/audio-quality-of-sbc-xq-bluetooth-audio-codec
Appendix
Below are Df measurements of the codecs with standard technical signals. For research purposes only.
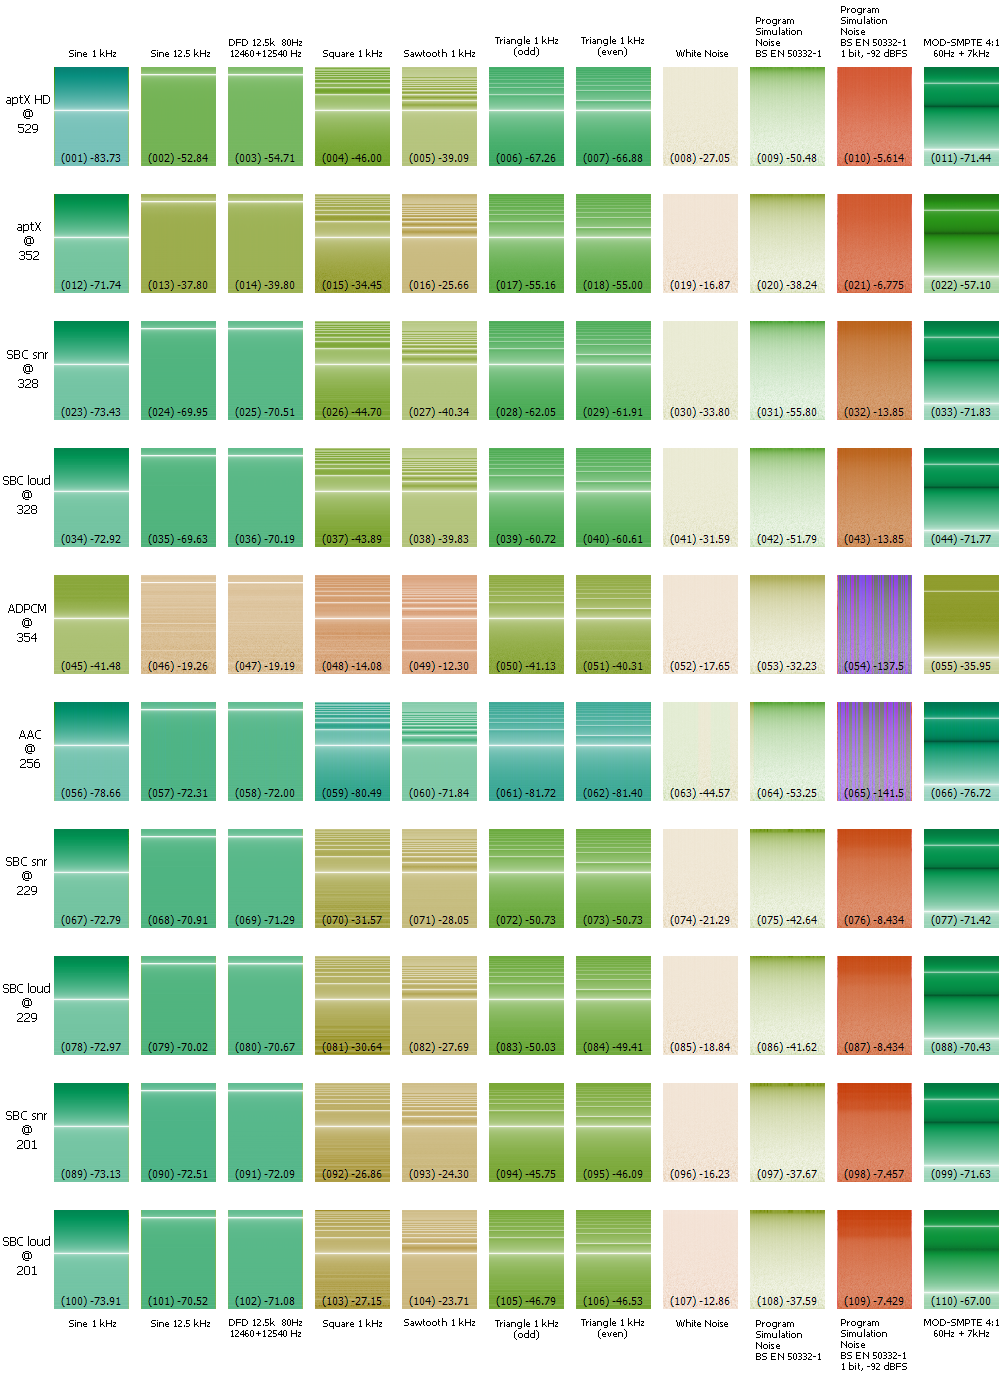
Figure 3. Diffrograms with corresponding Df median values in dB for the codecs. Order of the codecs is the same as in Fig.1. Numbers in brackets are for quick referencing. Details of the tech. signals can be found here. More about diffrograms - here.
None of these signals can be used for assessment of sound quality, they are for better understanding of encoders' internal mechanics only.