Published Date 5/28/19 11:00 AM
 Why not to test some modern entry-level smartphone? What audio quality could we expect? Xiaomi Redmi 6A - around $100. Let's see.
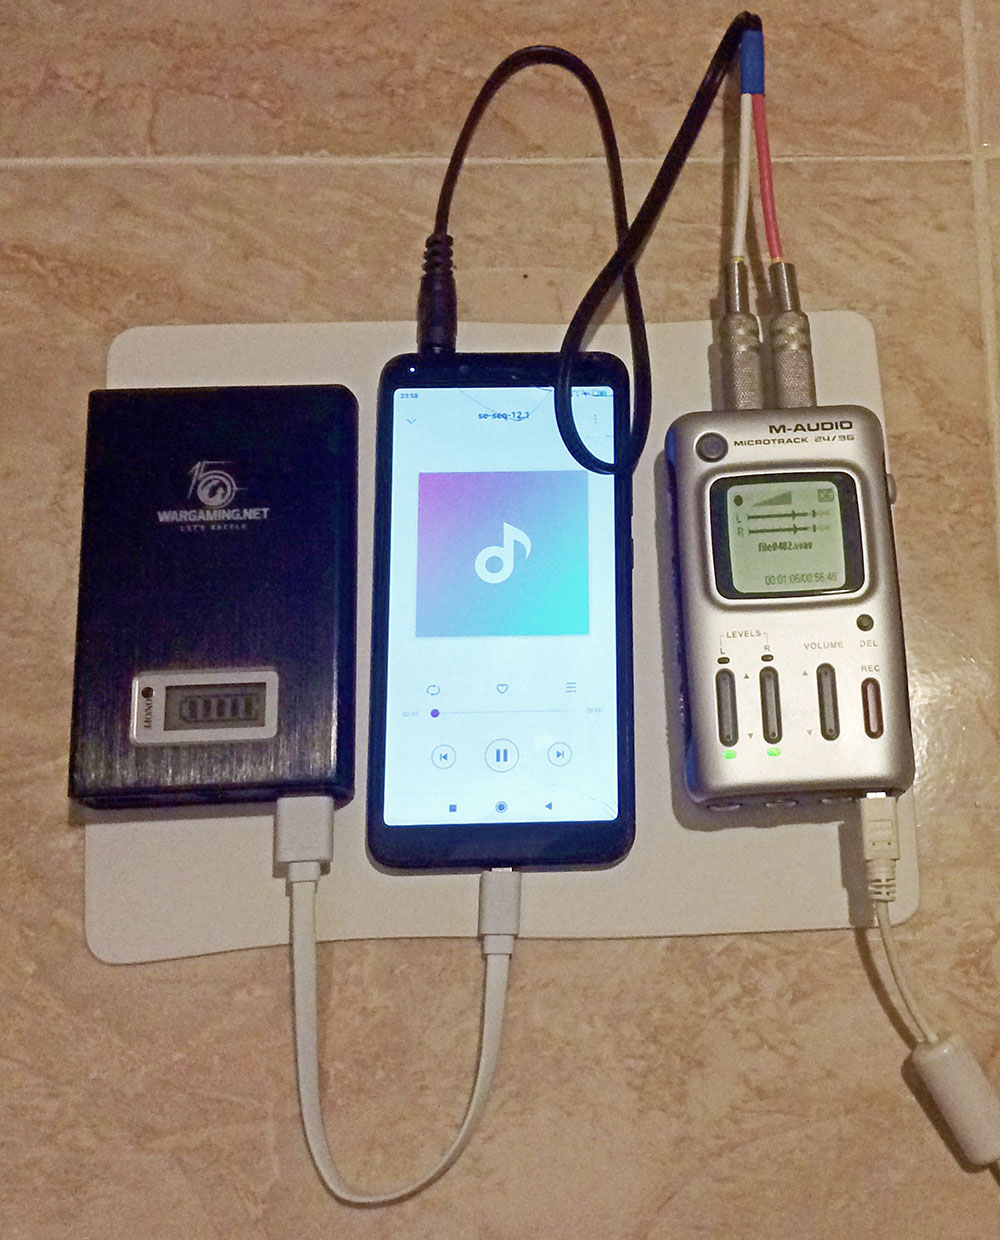
Figure 1. Recording of SE test sequences, which include both technical signals and various music material (the test set "Variety"). Processing of these records results in standard df-measurements presented on Fig.2 below.

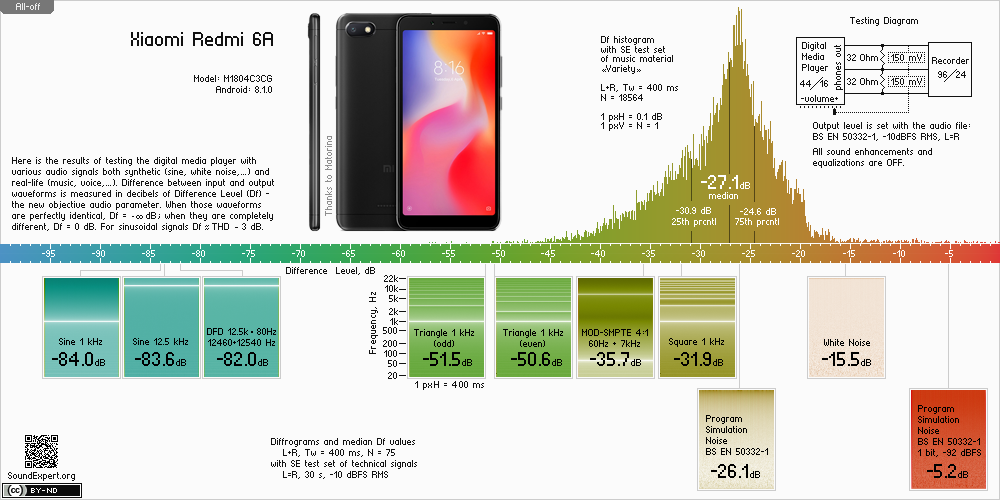
Figure 2. Df-slide with audio measurements of Redmi 6A. Df-slides of other devices can be compared with each other on the Portable players page.
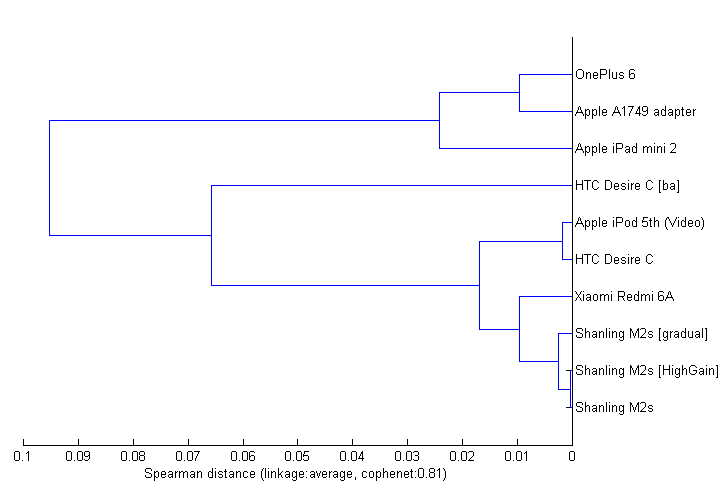
Almost all technical signals are reproduced by the smartphone more accurately than by many devices tested to the moment. Not surprising that real music signal also shows low Df level (the Median, -27.1dB). Artifact signature of Redmi 6A is very close to Shanling M2s (Fig.4) and six out of ten tech.signals have better Df levels with Redmi 6A, including the Median. For sure, Redmi 6A sounds as good as dedicated Hi-Rez. M2s, at least with 32 Ohm headphones. It looks like high quality sound is a standard feature now in smartphones.
Conclusion:
Audio quality of Xiaomi Redmi 6A is in line with top smartphones. Amaxing.
Appendix
All-off | 1 | 2 | 3 | 4 | 5 | 6 | 7 | 8 | 9 | 10 | 11 | 12 | 13 | 14 | 15 | 16 | 17 | 18 | 19 | 20 | 21 | 22 | 23 | 24 | 25 | 26 | 27 | 28 | 29 | 30 | 31 | 32 | 33 | 34 | 35 |
 | __ref2.wav(44)__mono_400-41.4956-25.9723-5.0518.png) | __ref3.wav(44)__mono_400-33.5328-25.6237-5.1995.png) | __ref4.wav(44)__mono_400-41.3300-33.4198-23.7933.png) | __ref5.wav(44)__mono_400-45.2744-26.8068-5.1429.png) | __ref6.wav(44)__mono_400-41.5588-27.3326-19.2818.png) | __ref7.wav(44)__mono_400-43.4109-32.2971-21.7159.png) | __ref8.wav(44)__mono_400-31.0682-26.1877-16.7339.png) | __ref9.wav(44)__mono_400-41.5211-24.1584-21.2210.png) | __ref10.wav(44)__mono_400-33.9001-24.3103-1.7958.png) | __ref11.wav(44)__mono_400-38.9848-29.8929-2.3996.png) | __ref12.wav(44)__mono_400-36.3830-25.4769-13.6570.png) | __ref13.wav(44)__mono_400-40.1135-26.4963-14.1657.png) | __ref14.wav(44)__mono_400-41.0232-27.9907-11.3277.png) | __ref15.wav(44)__mono_400-43.7045-35.5145-4.1742.png) | __ref16.wav(44)__mono_400-38.4926-27.5369-3.3842.png) | __ref17.wav(44)__mono_400-42.0690-34.2688-3.9303.png) | __ref18.wav(44)__mono_400-35.5049-26.4854-14.7874.png) | __ref19.wav(44)__mono_400-43.9462-33.5164-12.2324.png) | __ref20.wav(44)__mono_400-57.0824-38.8620-14.1406.png) | __ref21.wav(44)__mono_400-38.9987-31.7024-7.1521.png) | __ref22.wav(44)__mono_400-35.8846-24.1433-15.0404.png) | __ref23.wav(44)__mono_400-35.1263-26.4889-23.8040.png) | __ref24.wav(44)__mono_400-31.7330-21.3697-19.2709.png) | __ref25.wav(44)__mono_400-37.2897-28.1967-19.7937.png) | __ref26.wav(44)__mono_400-45.2666-26.3484-15.3163.png) | __ref27.wav(44)__mono_400-49.3885-23.6528-1.5680.png) | __ref28.wav(44)__mono_400-49.2582-20.6259-13.4296.png) | __ref29.wav(44)__mono_400-33.3694-26.5183-20.5378.png) | __ref30.wav(44)__mono_400-38.9147-26.7283-11.0751.png) | __ref31.wav(44)__mono_400-37.6049-26.5510-12.9689.png) | __ref32.wav(44)__mono_400-40.9546-20.8251-11.3268.png) | __ref33.wav(44)__mono_400-41.8520-34.2904-12.2571.png) | __ref34.wav(44)__mono_400-50.2526-26.7123-20.2412.png) | __ref35.wav(44)__mono_400-45.1407-28.3842-25.5466.png) |
| -30.4 | -26.0 | -25.6 | -33.4 | -26.8 | -27.3 | -32.3 | -26.2 | -24.2 | -24.3 | -29.9 | -25.5 | -26.5 | -28.0 | -35.5 | -27.5 | -34.3 | -26.5 | -33.5 | -38.9 | -31.7 | -24.1 | -26.5 | -21.4 | -28.2 | -26.3 | -23.7 | -20.6 | -26.5 | -26.7 | -26.6 | -20.8 | -34.3 | -26.7 | -28.4 |
Figure 3. Diffrograms of 35 tracks of the test set “Variety”, played back through Redmi 6A. They show level of waveform degradation of the musical signal divided into 400ms chunks (one pixel each, max. degradation is Red). Median Df values of the tracks are indicated. Click a track to open in full size for quick comparison with similar tracks from another device. More about diffrograms → Diffrogram: visualization of signal differences in audio research.
| Figure 4. Dendrogram showing similarity of artifact signatures of tested players. The shorter the link between two players, the more similar their artifact signatures. |  |
Table 1. Underlying matrix of Spearman distances between artifact signatures for the dendrogramm. The Spearman distance = 0.1 is critical for relation of Df measurements to subjective scores. For the players that have similar artifact signatures (distance < 0.1) their perceived sound quality correlates well to df-measurements performed with substantial amount of real-life music material (histogram medians). | | (1) (2) (3) (4) (5) (6) (7) (8) (9) (10) |
 (1) Apple iPad mini 2
 (2) HTC Desire C
 (3) HTC Desire C (ba)
 (4) Shanling M2s
 (5) Shanling M2s (HighGain)
 (6) Shanling M2s (gradual)
 (7) Apple A1749 adapter
 (8) OnePlus 6
 (9) Apple iPod 5th (Video)
(10) Xiaomi Redmi 6A | 0 0.0619 0.0972 0.0445 0.0446 0.0334 0.0374 0.0111 0.0578 0.0318
0.0619 0
0.0972 0.0655 0 0.0651 0.0651 0.0660 0.1710 0.1306 0.0612 0.0712
0.0445 0.0149 0.0651 0 0.0002 0.0024 0.1378 0.0887 0.0112 0.0103
0.0446 0.0147 0.0651 0.0002 0 0.0025 0.1379 0.0888 0.0110 0.0106
0.0334 0.0174 0.0660 0.0024 0.0025 0 0.1229 0.0752 0.0140 0.0081
0.0374 0.1494 0.1710 0.1378 0.1379 0.1229 0 0.0095 0.1455 0.1135
0.0111 0.1029 0.1306 0.0887 0.0888 0.0752 0.0095 0 0.0988 0.0689
0.0578 0.0017 0.0612 0.0112 0.0110 0.0140 0.1455 0.0988 0 0.0235
0.0318 0.0286 0.0712 0.0103 0.0106 0.0081 0.1135 0.0689 0.0235 0 |