The audio measurements below illustrate how accurately the various players reproduce the initial/recorded waveform. These devices are tested with both real music and technical signals. Waveform degradation is measured with the Difference level parameter, Df (in decibels). This shows how significantly the final studio mix is altered as a result of the playback device. A low Df level (blue area) implies less deterioration of the sound. Portable players with Df level below -70dB give a chance to a listener to hear any recording the way an audio producer (author) hears it in studio in headphones. The sound will be perfectly similar if a listener uses the same headphones model.
Measurements for each digital audio player (DAP) are presented as slides, with each showing Df levels for a dozen technical signals and two hours of music [SE test set "Variety"]. If a player has multiple modes of operation (for example, balanced/single-ended, high/low gain, DAC filter type, etc.), then its df-slide corresponds to the settings that provide the most accurate playback; the particular settings are listed on the slide under the player name (see Notes).
From a listener perspective, the most meaningful/helpful value on the df-slides is the histogram median, which correlates well with perceived sound quality. The diagram below summarizes the histogram medians for all DAPs tested so far:
<------------ Higher playback accuracy

Apple
ASUS
Astell&Kern
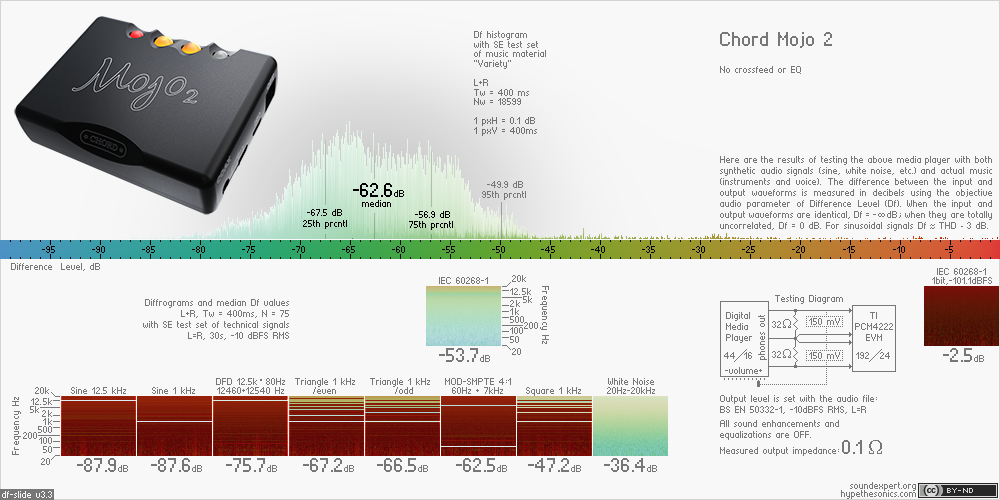
Chord
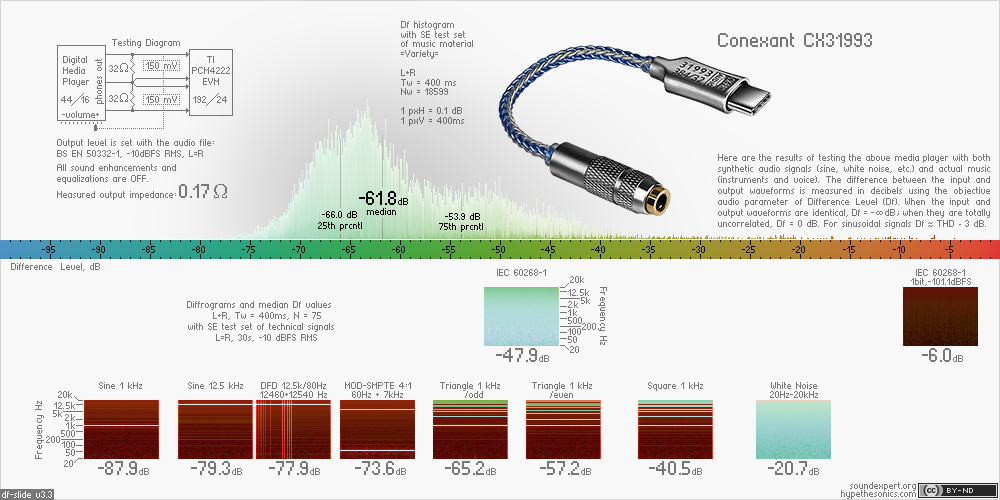
Conexant
FiiO
HiBy
Hidizs
iBasso
LG
Lotoo
Questyle
Samsung
Shanling
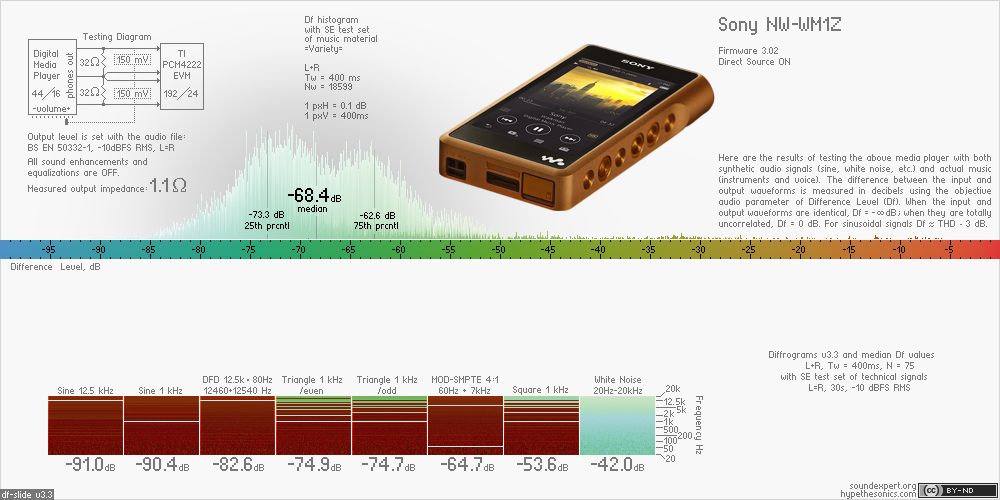
Sony
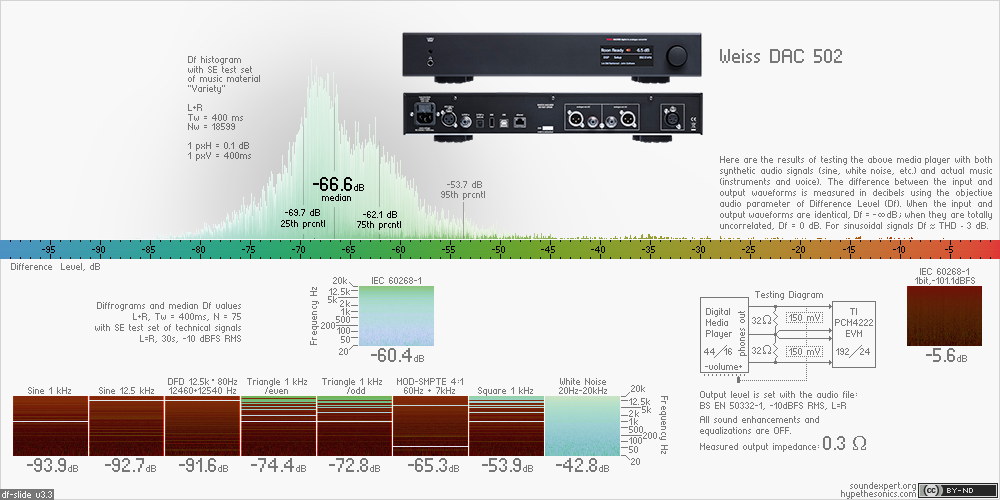
Weiss
Df-slides below are sorted by histogram median. Top df-slides represent portable players with higher playback accuracy.
.png)
.png)
.png)
.png)
.png)
.png)
.png)
.png)
.png)
.png)
.png)
.png)
.png)
Note(1) Anti-aliasing filters tend to have the largest effect on playback accuracy. In most cases, a filter frequency response with a sharp roll-off will provide better results.
Note(2) Balanced outputs tend to have higher output impedance than single-ended outputs (double usually), but otherwise exhibit very similar playback accuracy (+/-1 dB).
Note(3) High/low gain modes typically provide the same level of accuracy, however, note that all measurements are performed at the same output level regardless (150 mV into a static 32 Ohm load).
Note(4) Type/version of software players usually do not affect playback accuracy.
Note(5) Additional df-slides for these DAPs (different settings and modes) can be found on the HypetheSonics website - https://www.hypethesonics.com/dapti-database/
As we measure the degradation of our “Variety” music tracks with 400ms time resolution we know in great detail how each tested player corrupted our test signal. Such artifact signatures can be compared with each other finding similarities between them. As a result we can see how different tested players naturally fall into groups according to similarity of their artifact signatures. Such groups/clusters have been visualized in 3D similarity space below. You can zoom and rotate the image.
The portable players in similarity space. The closer devices to each other, the more similar their artifact signatures. The particular coordinate axes do not matter; only the distribution of devices among groups is valuable. The 1-dB grid helps to estimate the similarity between the devices visually. Colors of devices correspond to their histogram medians. For players that have close artifact signatures - the distance less than 2 dB - their perceived sound quality is well-defined by their Df medians. [The measure of similarity (the distance) is mean-corrected MAE (dB). 3D visualization of n-dimensional distance matrix is computed by means of multidimensional scaling].
These innovative and highly-revealing audio measurements became possible thanks to Paul and Maurice from hypethesonics.com and support from audio enthusiasts like you. We plan 100+ devices to test.
Feel free to create NFTs for the df-slides above. These slides are unique collectibles of pixel art showing the first public practical application of the new and open source audio metric - df-metric. By tokenizing df-slides you will help to preserve these measurements non-altered.
If you’re able to consider donating, please, specify which player you would like to see in the database. You can also design a personal plate (64x64px) for the screen below. Thank you!

Anonymous
0.84175 mBTC
($10)
2020.08.16

King of tekken
33450 RUB
($458)
2020.09.10

Vital Bazarov
300 LE
($19)
2020.09.13
Anonymous
$500
2021.02.01

A.Scherbakov
5300 RUB
($71)
2021.04.24
Anonymous
$200
2021.07.23
Anonymous
0.23418 mBTC
($10)
2021.08.07

A.Scherbakov
2000 RUB
($27)
2021.12.15
Anonymous
$250
2021.12.24
Kilian Köhler
€20
2022.03.02
Anonymous
$14
2022.04.24
Anonymous
$210
2022.05.02

HypetheSonics
$250
2022.12.19
The measurement campaign is a part of the Audio-Transparency Initiative by SoundExpert
exceptional audio quality for everyone
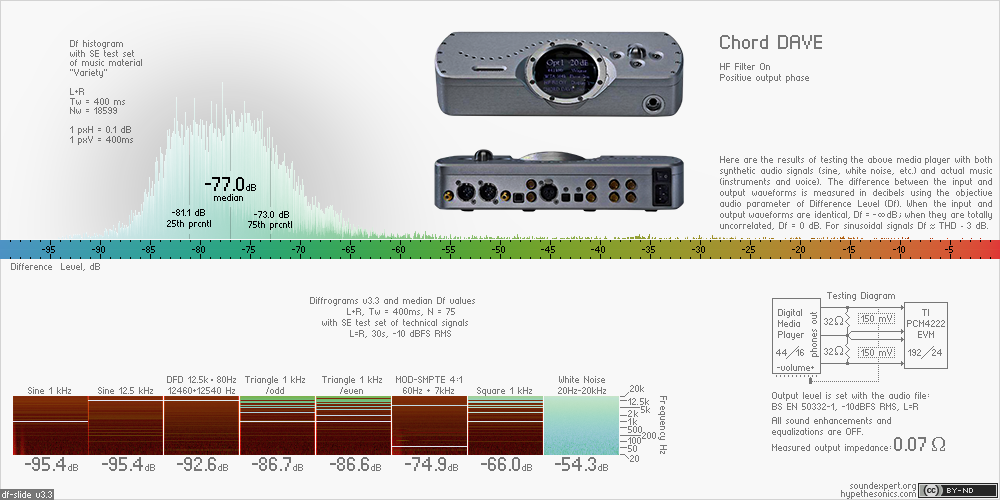
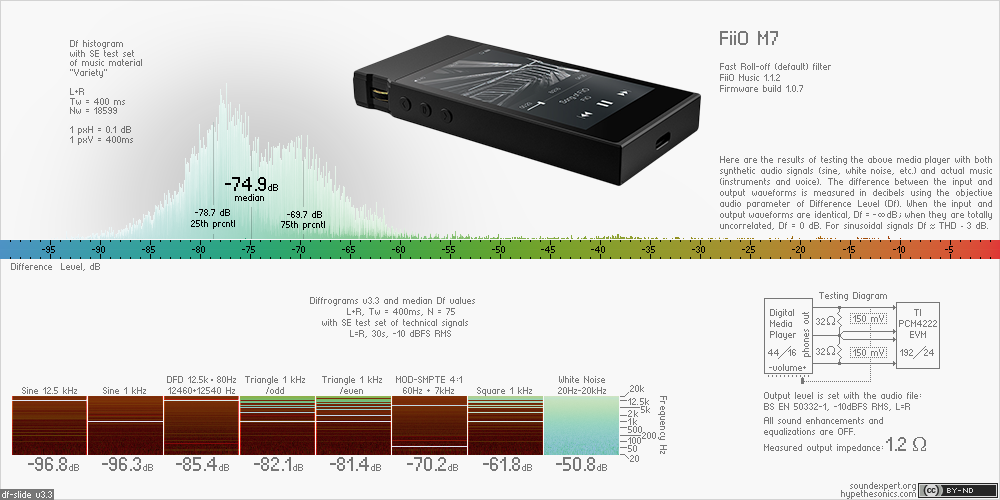
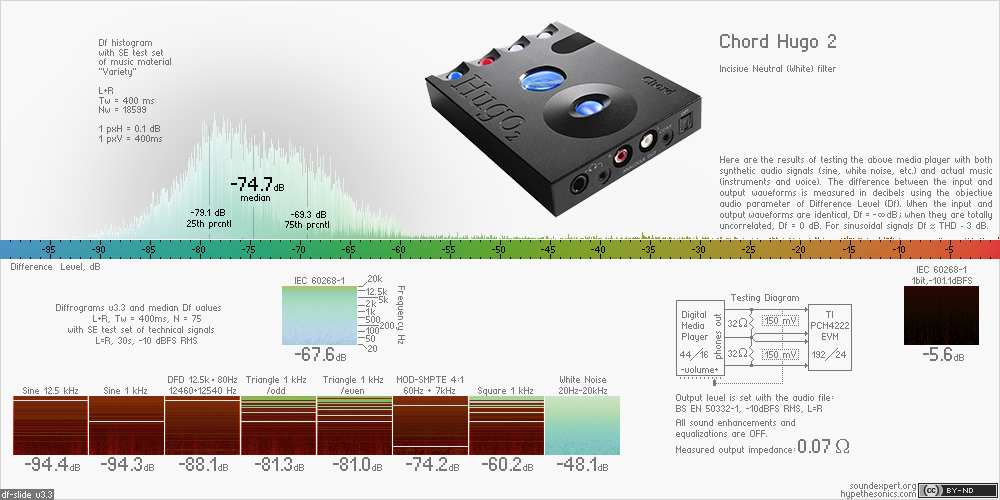
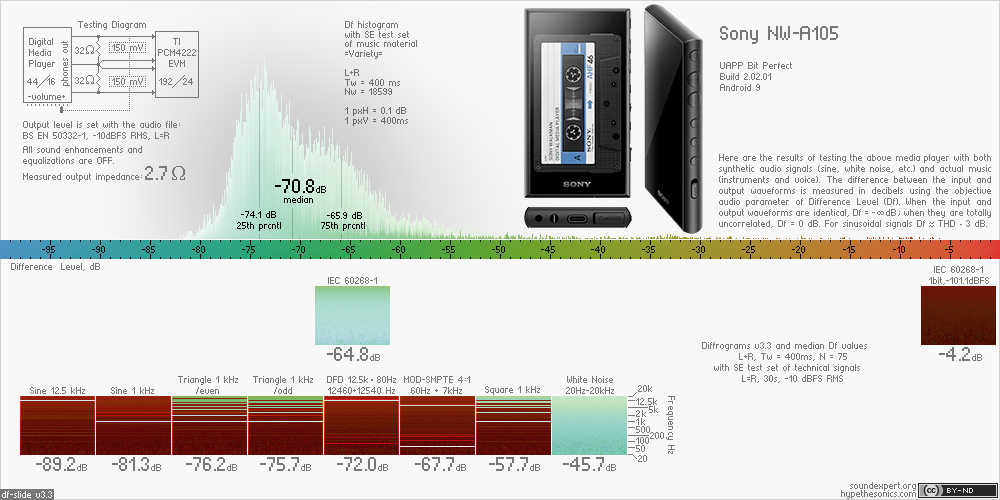
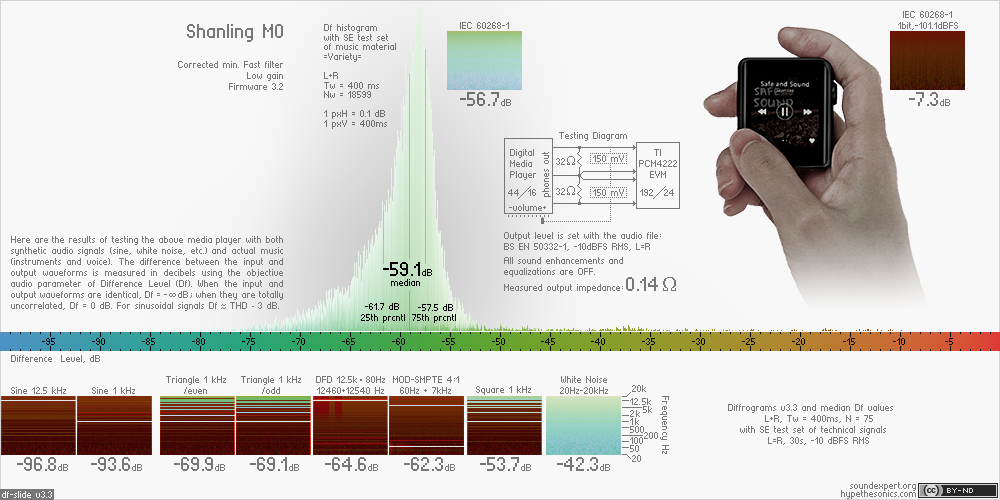
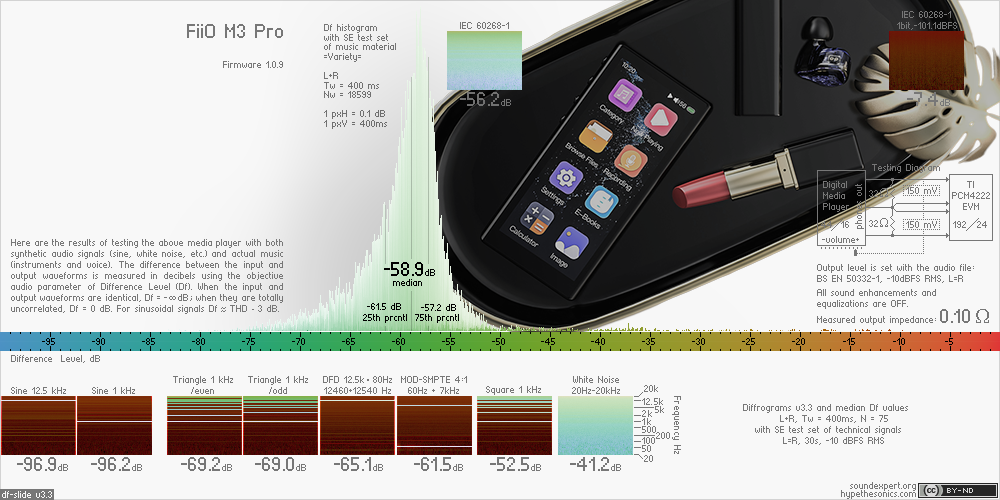
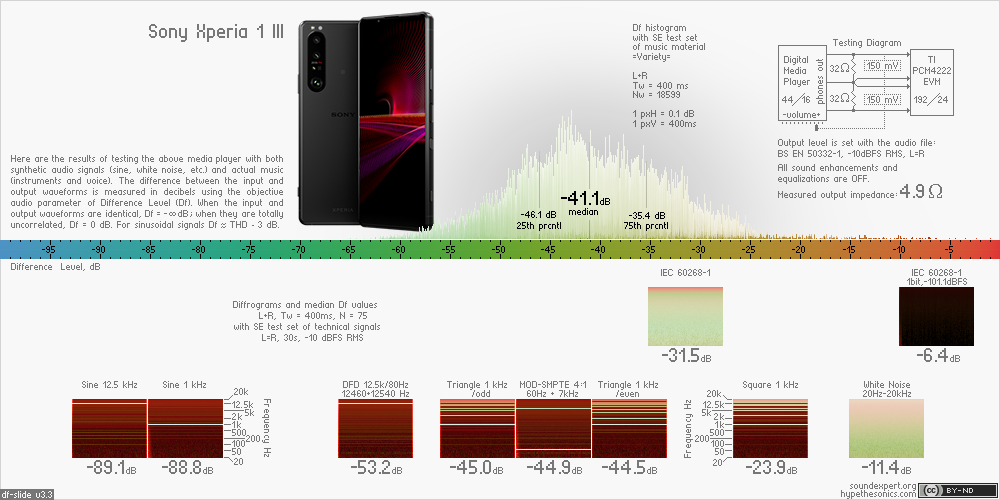
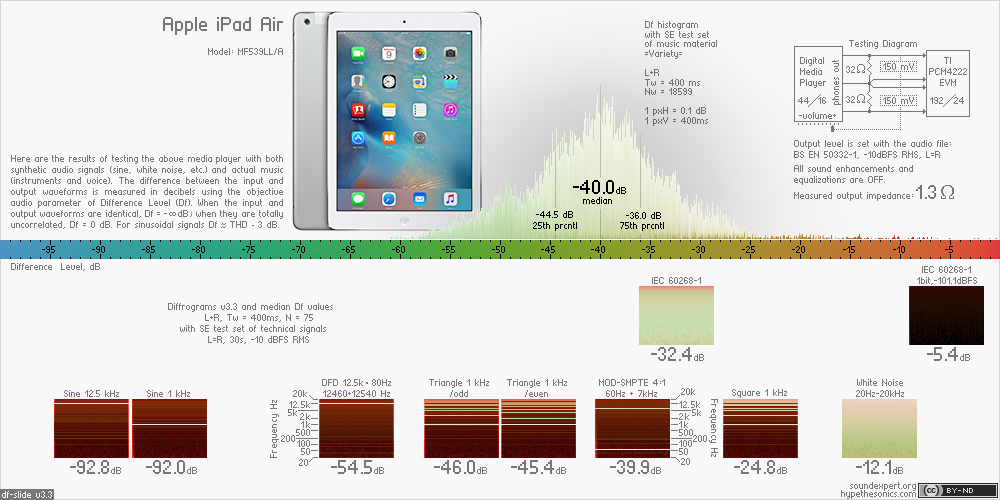
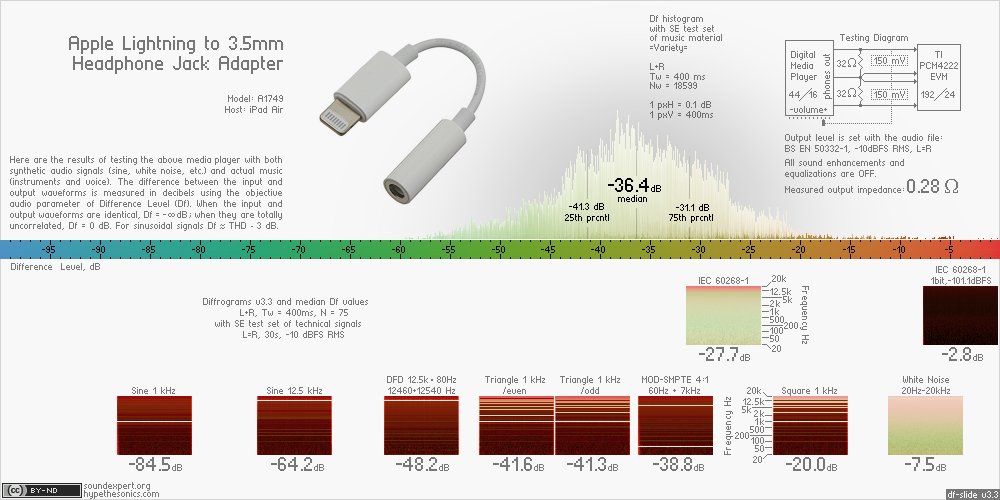
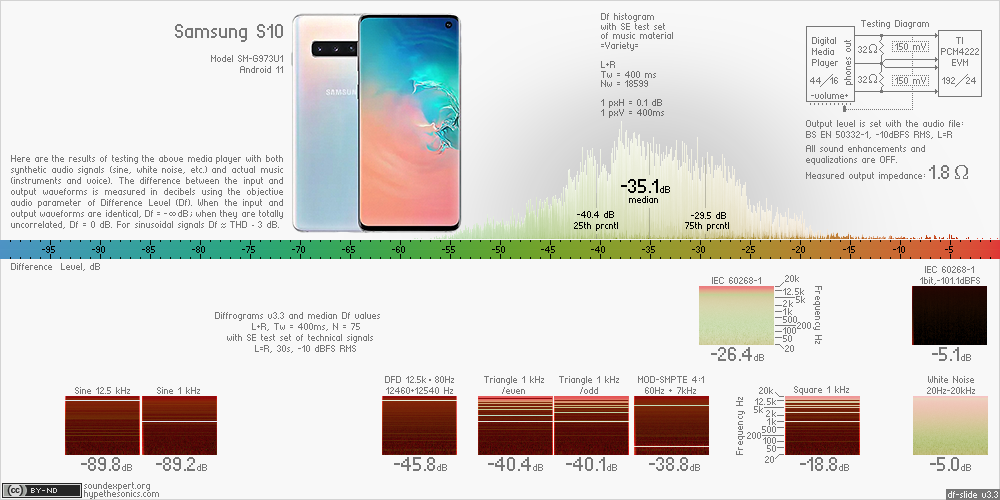
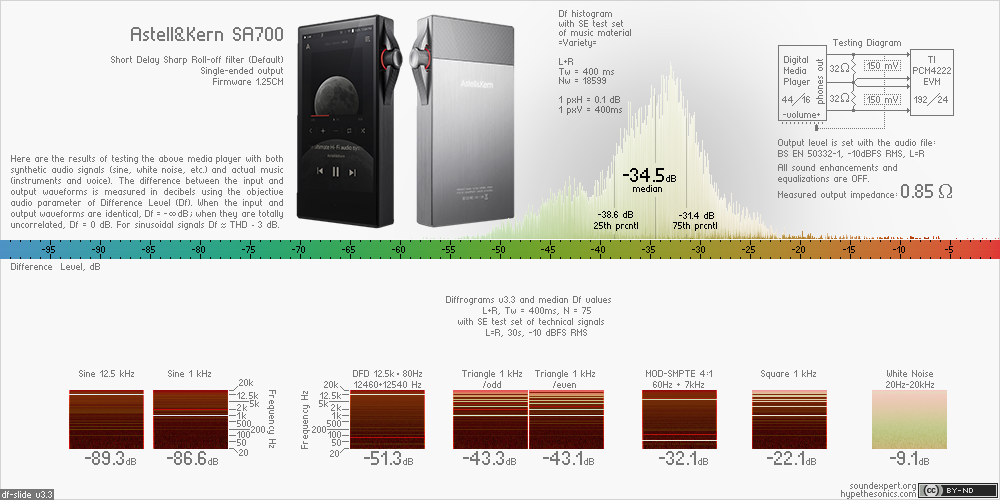
A histogram on df-slide is the result of testing a player with the real-life audio material - 35 full tracks of various genres (the test set "Variety"). During playback, the Df value is measured for every 400ms of the output signal. Thus two hours of music result in 18599 Df values which are presented in the form of a histogram. In each histogram bin Df values are sorted by the energy of corresponding signal frames - lower energy frames are at the bottom and have darker colors.
The median of Df values indicates the average level of signal degradation in the device. The shape of the histogram relates to the character of that degradation - artifact signature of the device. From a listener perspective, the histogram is the most informative indicator of audio quality; the median correlates to subjective audio quality better than any other audio parameter.
The rectangles on df-slide are diffrograms showing degradation of technical signals with time (horizontal dimension) and frequency (vertical dimension). All the signals are 30s long and provide 75 Df levels each [75=30s/400ms]. Median of these values - a robust estimator of the signal degradation - is indicated under corresponding diffrogram.
The diffrograms show the level of degradation for the following technical signals:
Sine 1 kHz. For Sine input signal Df = (THD+Noise) - 3dB. This is a bridge between the traditional audiometric and the new df-metric.
Sine 12.5 kHz. The Sine signal of higher frequency. The Df of a properly designed audio circuit with this signal is close to its Df with Sine 1 kHz. The signal is also helpful for revealing time inconsistency of the output signal (jitter). Such inconsistency translates into color inconsistency from left to right on a diffrogram (like in the df-slide above).
DFD. A mix of two Sine waves - 12460 Hz and 12540 Hz. This is a standard signal for measuring inter-modulation distortion (IMD). When the latter is low, Df with this signal is close to Df with Sine 12.5 kHz.
Triangle odd/even. A standard triangle signal with odd-only harmonics and quasi-triangle signal with even-only harmonics of the same amplitudes [for research of harmonic components of distortion].
MOD-SMPTE 4:1. A mix of two sine waves 60 Hz and 7 kHz in 4:1 proportion. A standard signal for measuring inter-modulation distortion (IMD). In df-metric it doesn't work as such because it also reveals the phase distortion [additional research needed].
PSN IEC 60268-1. Pink noise, filtered and dynamically compressed. A standard signal that simulates a real audio program. Its Df is usually close to the median of the histogram above. This is the most meaningful technical signal in df-metric from a listener perspective.
Square 1 kHz. A square wave for measuring slew rate [additional research needed].
White Noise. This is the toughest test for any audio circuit. It reveals all possible types of degradation but in unclear proportion [additional research needed].
PSN IEC 60268-1, 1bit, -101.1 dBFS. The Program Simulation Noise additionally down-scaled to 1 bit. It simulates a real audio program (16 bit) at the lowest possible level. The better its Df value, the more detailed sound you'll hear, especially in quiet passages. It is the equivalent of the SNR parameter of traditional audiometric.
The Creative Commons license [BY-ND] allows to copy and redistribute unmodified df-slides for any purpose, even commercially.
 2001-2023 SoundExpert
 .png)
.png)
.png)
.png)