The problem with parametric measurements of SRC is the difficulty to correlate all those parameters (pre-ringing, impulse response, aliasing/transition ....) and their combinations to perceived sound quality with real music signal. The cumulative impact of the various artifacts at different levels can be estimated only having some non-trivial experience in the field.
Fig.2 Diffrogram of 64f→32f bit reduction. Higher energy portions of the audio are still grey/white, while lower energy ones show some degradation. This is the Lab Anchor, it shows the accuracy of 32-float audio.
ref.wav(44)_out32f.wav(44)_left_100_Wf-154.77[-Inf-139.42]_Wm0_Sm0_v336.png
Bit reduction from 64f to 24int looks as follows:
Fig.3 Diffrogram of 64f→24int bit reduction. Further worsening of DF levels. This is the High Anchor, it shows the accuracy of 24-bit audio.
ref.wav(44)_out24int.wav(44)_left_100_Wf-126.99[-Inf-72.26]_Wm0_Sm0_v336.png
And finally the well-known bit reduction from 64f to 16int(with Triangle dithering):
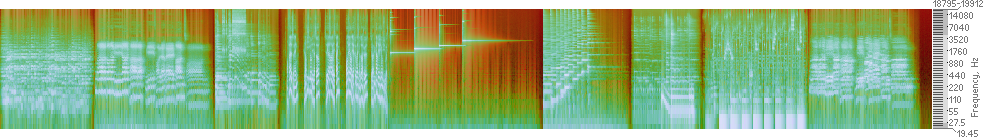
Fig.4 Diffrogram of 64f→16int(TPDF, [-1,+1]) bit reduction. Even more worsening of DF levels. This is the Low Anchor, it shows the accuracy of CD-audio.
ref.wav(44)_out16dT.wav(44)_left_100_Wf-73.76[-86.46-2.68]_Wm0_Sm0_v336.png
In order to use diffrograms at max precision the SRC conversion was performed twice (44.1k→96k→44.1) with the same SRC parameters. Fortunately, all modern and high quality resamplers after such conversion produce sample accurate output and simple correlation can be used to compute DF levels; without time-warping that has its own limit of precision (DF ~ -100dB) and therefore can not be used in SRC testing, which requires significantly higher level of precision (DF ~ -150dB).
Let's start with iZotope RX 11 Advanced (64-bit, v11.4.0.4692). It allows fine-tuning of SRC parameters and here is the conversion with default settings [Filter Steepness=32, Cutoff shift=1, Pre-ringing=1]. These settings define SRC with moderate steepness linear filter and cut-off at Nyquist frequency:
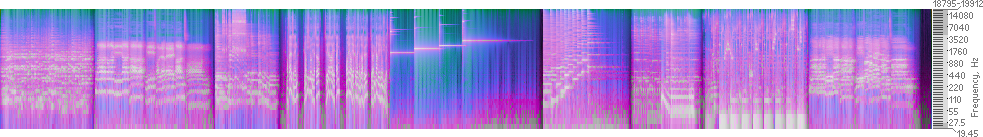
Fig.5 Diffrogram of RX 11 SRC with default settings.
ref.wav(44)_rxDefault.wav(44)_left_100_Wf-127.22[-154.77-70.66]_Wm0_Sm0_v336.png
Increasing the filter steepness to max 2000 results in:
Fig.6 Diffrogram of RX 11 SRC with max filter steepness.
ref.wav(44)_rx1-L.wav(44)_left_100_Wf-142.64[-Inf-62.23]_Wm0_Sm0_v336.png
The median DF value is better by ~15dB with steep filter; due to more accurate reproduction of high frequencies around 20k (less green top of the diffrogram); in the most audible region both diffrograms are almost identical.
In RX 11 the cut-off frequency can be adjusted below and above Nyquist, let's see how reduced bandwidth and aliasing show up on diffrogram. For the purpose the signal was processed with cut-off frequencies half-tone above (23361Hz) and half-tone below (20812Hz) the Nyquist (22050Hz). The linear steep (2000) filter is as in previous example (Fig.6).
Fig.7 Diffrogram of RX 11 SRC with max filter steepness and reduced bandwidth (cut-off=20812Hz); greener top indicates increased degradation of frequences above 12.5k.
ref.wav(44)_rx094-L.wav(44)_left_100_Wf-110.10[-148.41-38.63]_Wm0_Sm0_v336.png
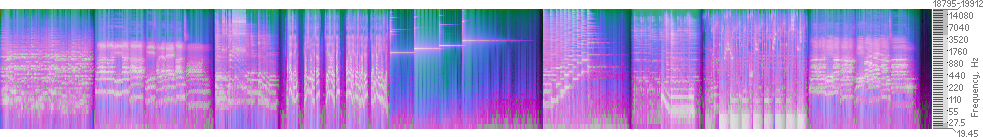
Fig.8 Diffrogram of RX 11 SRC with max filter steepness and increased bandwidth (cut-off=23361Hz); greener top indicates very similar degradation of frequences above 12.5k but now due to aliasing.
ref.wav(44)_rx106-L.wav(44)_left_100_Wf-109.44[-150.51-44.51]_Wm0_Sm0_v336.png
Thus the minimum degradation of a signal is achieved with steep linear filter with cut-off at Nyquist. It should be noted that the true minimum of degradation in RX 11 is achieved with cut-off=22054Hz; probably due to particular realization of the ideal filter in RX 11:
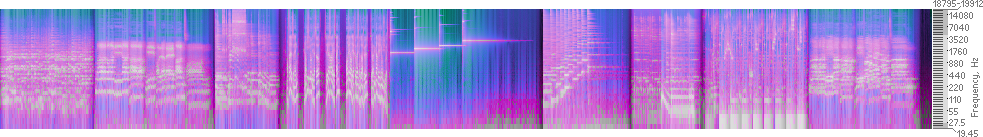 Fig.9 Diffrogram of RX 11 SRC with max filter steepness and cut-off=22054Hz ("true Nyquist")
ref.wav(44)_rx19-L.wav(44)_left_100_Wf-149.55[-Inf-72.14]_Wm0_Sm0_v336.png
The fine tuning of cut-off frequency brought additional 7dB of SRC accuracy and very clean highs - better conversion at no-cost. This is the most transparent SRC in RX 11, its quality is comparable to 32f-bit audio (Fig.2) and better than 24-bit audio (Fig.3).
Another issue worth researching is pre-ringing. Minimum/intermediate phase response filters are used to fight it. Here are the diffrograms of the SRC from Fig.9 but with non-linear phase responses:
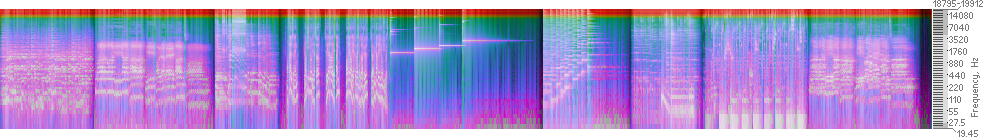
Fig.10 Diffrogram of RX 11 SRC with max filter steepness and cut-off=22054Hz ("true Nyquist") using intermediate phase response filter.
ref.wav(44)_rx19-050.wav(44)_left_100_Wf-47.30[-78.02-5.38]_Wm0_Sm0_v336.png
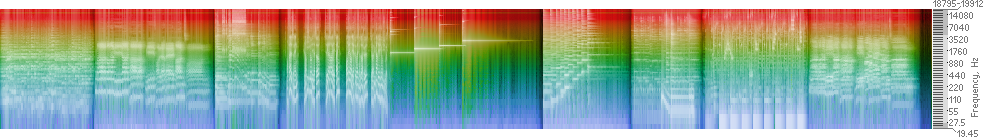
Fig.11 Diffrogram of RX 11 SRC with max filter steepness and cut-off=22054Hz ("true Nyquist") using minimum phase response filter.
ref.wav(44)_rx19-000.wav(44)_left_100_Wf-35.92[-53.61-0.39]_Wm0_Sm0_v336.png
Both filters result in significand degradation of the signal at high frequencies and no visible improvements in comparison to linear filter use (Fig.9). Fighting pre-ringing with these filters is questionable at best. At least in case of steep filter with cut-off at Nyquist, - non-linear phase responce improves nothing. According to the measurements above the use of linear phase response filter is preferable because even having some pre/post-echo artifacts, their level is so low they are not noticeable for sure. RX11, Adobe Audition, Audacity and many others use Linear phase response filters in their SRC by default, which is reasonable.
In order to illustrate performance of state-of-the-art resamplers I chose ARDFTSRC and PGGB. Both use DFT for the purpose and show the outstanding results:
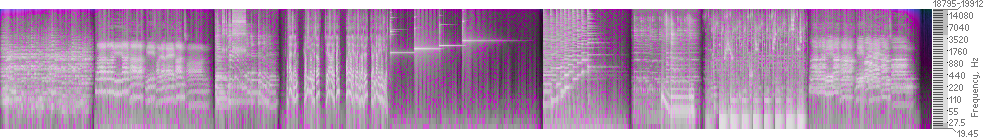
Fig.12 Diffrogram of ARDFTSRC with max settings:
ffmpeg -i ref.flac -af asf2sf=dblp,ardftsrc=96000:quality=61656210:bandwidth=1 -c:a pcm_f64le 9664.wav
ffmpeg -i 9664.wav -af asf2sf=dblp,ardftsrc=44100:quality=61656210:bandwidth=1 -c:a pcm_f64le out1.wav
ref.flac(44)_out1.wav(44)_left_100_Wf-Inf[-Inf-91.69]_Wm0_Sm5000_v336.png
https://github.com/rorgoroth/mingw-cmake-env/releases/tag/latest
Most signal artifacts of this double conversion are lower than computational errors of our measurement algorithm ). Some imperfections are visible only at the signal edges. But they disappear when the same signal is processed inside longer test vector:
Fig.13 Diffrogram of ARDFTSRC with max settings when the test signal is part of a longer test signal (9.5min).
ref.wav(44)_ardftsrcMax.wav(44)_left_100_Wf-Inf[-Inf-148.75]_Wm0_Sm0_v336
The dependency on surrounding signals is even more pronounced with PGGB resampler:
Fig.14 Diffrogram of PGGB resampler with max settings [Output:64(Float), Precision:64Bit, No Filtering] and processing the test signal alone.
ref.flac(44)_PGGBse9.wav(44)_left_100_Wf-Inf[-Inf-47.05]_Wm0_Sm5000_v336.png
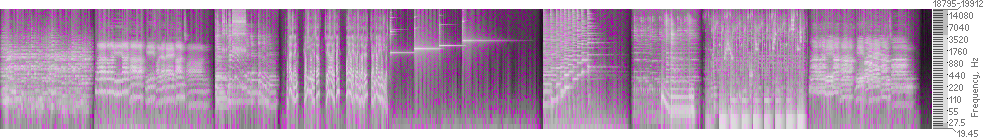
Fig.15 Diffrogram of PGGB resampler with max settings [Output:64(Float), Precision:64Bit, No Filtering] and processing the test signal inside longer signal.
ref.wav(44)_PGGB.wav(44)_left_100_Wf-Inf[-Inf-150.00]_Wm0_Sm0_v336.png
Longer test vectors are processed more accurately by these resamplers, though the difference is not significant. In this resampling case [44.1|16→96|64f→44.1|64f] all the precision settings in PGGB [64/107/128/256-bit] produce the same accuracy of resampling. Both resamplers with these max settings require huge computing power and memory.
***
Diffrogram, defined in DF-metric, is a powerful and yet simple/straightforward audio research instrument, especially at small levels of degradation where psychoacoustic effects are non-existent. The latest Diffrogram utility (v3.36, Matlab), used for computing DF levels and diffrograms, is on GitHub (with usage examples and verification vectors) -
https://github.com/serge-SE/diffrogram/releases/tag/v3.36
Alternative rating of resamplers according to DF metric is opened on the page -
Accuracy of SRC in Audio. DF-slides on that page include DF measurements/diffrograms with some technical signals, longer musical signal and additionally show magnitude and phase degradation. Corresponding DF values on DF slides are 1~2dB better because they are computed for L+R signals there.
Discussions: