Published Date 1/12/19 1:05 PM
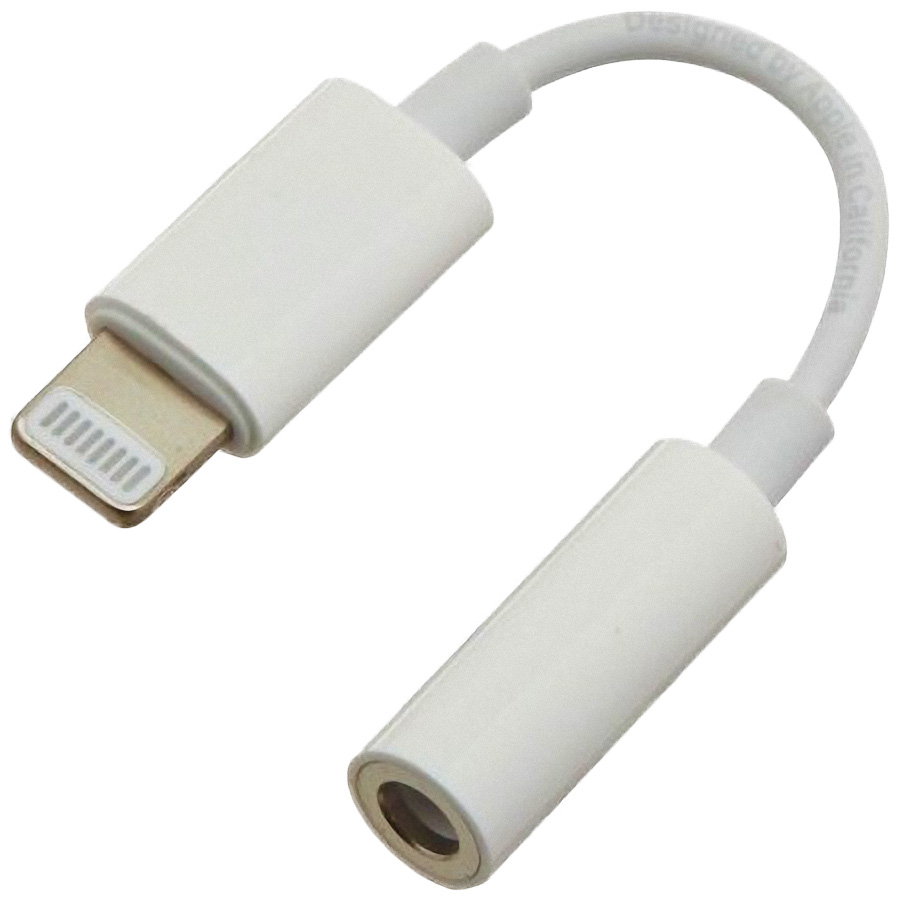 | Figure 1. Apple adapter A1749 |
Lightning to 3.5mm adapter (A1749) is a solution Apple offers after disappearing headphone jack from iPhones. The features of the adapter in short:
1. Mass audio product, supplied with every iPhone without headphone jack.
2. Retail price is $9.
3. DAC+headphone amplifier are inside lightning connector (see Fig.2 and the teardown at IFIXIT).
 Figure 2. X-ray image of Apple’s A1749 adapter by Creative Electron
4. Surprisingly good traditional audio measurements made by Ken Rockwell and Archimago.
| Figure 3. SE measurement procedure is mainly the recording of some test sequences, played by device under test. Standard SE test sequence includes 10 test signals and two hours of various music material. | 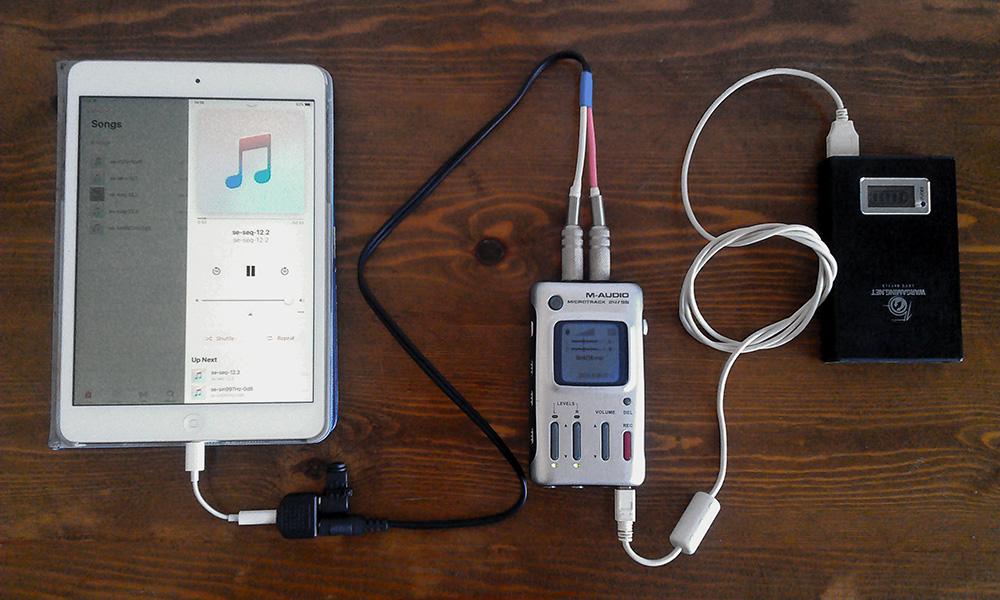 |
Results of standard SE df-measurements of the adapter:
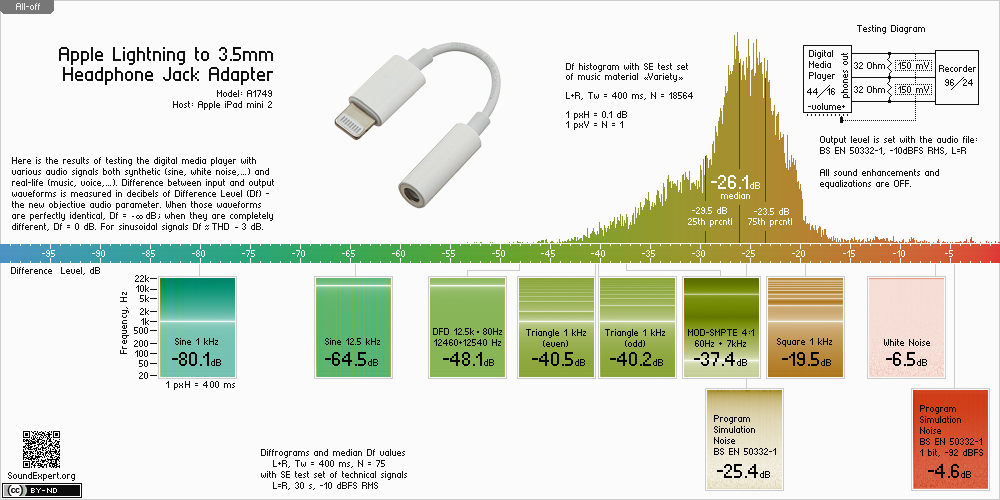
Figure 4. Df-slide with results of testing A1749. Df-slides of various devices can be compared to each other on the Portable players page.
The adapter was tested with iPad mini. The latter has been tested earlier, its df-slide is below:
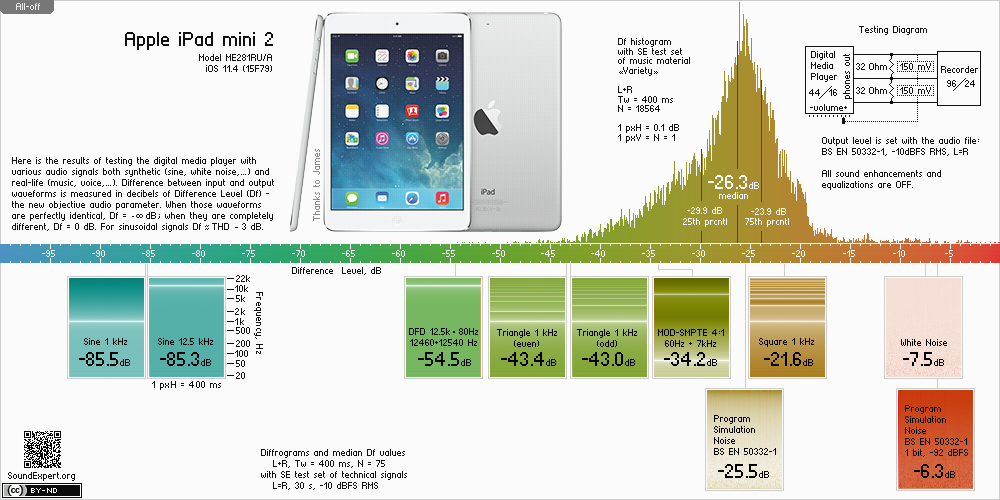
Figure 5. Df-slide with results of testing iPad mini 2, which was used as a host for testing A1749 adapter.
 | Figure 6. Enlarged version of Sine12.5kHz diffrogram from Fig.4. Vertical “greener” lines show time inconsistency of the output signal. This is how jitter looks like. |
Conclusions:
(1) Artifact/sound signatures of both the adapter and iPad mini are similar (close Df values and their relative positions, similar histograms). The adapter utilizes the same audio solution that is used in iPhones 4/5/6 and other portable audio devices by Apple.
(2) Vertical stripes on Sine12.5kHz diffrogram in Fig.4 (enlarged version - Fig.6) reveal small time inconsistency of the adapter's output signal (probably, clock generator of lightning interface is the source). High frequency components of a signal are affected the most by such time instability or jitter. Real-life music signal is almost not affected (+0.2dB).
(3) Just for reference, white noise diffrogram of the adapter (Fig.4) reveales steep cut off of frequency response near Nyquist frequency.
(4) Just for reference, in case of the adapter all SE test signals show a bit worse Df values in comparison to iPad mini. Except MOD-SMPTE 1:4 signal, which is reproduced more accurately by the adapter (-3.2dB, additional research needed).
Audio quality of Apple Lightning to 3.5mm adapter (A1749) is almost as good as in-built mobile audio solutions by Apple, though it has slightly worse df-measurements. Mostly due to the higher jitter. But if you listen music you will not hear the difference; it is too subtle to be perceived.
Appendix
1. Diffrograms of 35 tracks of the test set “Variety”, played back through A1749 adapter. They show level of waveform degradation of the musical signal divided into 400ms chunks (one pixel each). Median Df values of the tracks are indicated. Click a track to open in full size for quick comparison with similar tracks from another device. More about diffrograms → Diffrogram: visualization of signal differences in audio research.
All-off | 1 | 2 | 3 | 4 | 5 | 6 | 7 | 8 | 9 | 10 | 11 | 12 | 13 | 14 | 15 | 16 | 17 | 18 | 19 | 20 | 21 | 22 | 23 | 24 | 25 | 26 | 27 | 28 | 29 | 30 | 31 | 32 | 33 | 34 | 35 |
 | __ref2.wav(44)__mono_400-38.1191-25.1176-4.3306.png) | __ref3.wav(44)__mono_400-31.3038-25.5245-2.7034.png) | __ref4.wav(44)__mono_400-40.9684-33.1501-24.1657.png) | __ref5.wav(44)__mono_400-40.6115-26.6386-3.9412.png) | __ref6.wav(44)__mono_400-40.5276-26.6919-15.3728.png) | __ref7.wav(44)__mono_400-41.2030-32.0677-21.7194.png) | __ref8.wav(44)__mono_400-29.3464-24.3462-15.2746.png) | __ref9.wav(44)__mono_400-37.6943-24.1177-20.5035.png) | __ref10.wav(44)__mono_400-33.1421-23.5896-2.8647.png) | __ref11.wav(44)__mono_400-38.7063-26.7619-3.3272.png) | __ref12.wav(44)__mono_400-36.4110-22.5968-9.0657.png) | __ref13.wav(44)__mono_400-33.0395-21.8870-10.4114.png) | __ref14.wav(44)__mono_400-41.2354-27.8375-8.3037.png) | __ref15.wav(44)__mono_400-43.7943-35.8392-3.3102.png) | __ref16.wav(44)__mono_400-37.0817-25.9046-3.5043.png) | __ref17.wav(44)__mono_400-36.7338-27.8870-3.8295.png) | __ref18.wav(44)__mono_400-29.8679-25.1611-12.3051.png) | __ref19.wav(44)__mono_400-43.1453-33.2466-11.1963.png) | __ref20.wav(44)__mono_400-53.2684-37.9276-11.5083.png) | __ref21.wav(44)__mono_400-38.6125-31.6268-7.3841.png) | __ref22.wav(44)__mono_400-33.6711-23.5504-15.2651.png) | __ref23.wav(44)__mono_400-35.4352-24.5563-19.7069.png) | __ref24.wav(44)__mono_400-30.4904-21.7382-19.7153.png) | __ref25.wav(44)__mono_400-36.0778-27.2893-18.8757.png) | __ref26.wav(44)__mono_400-43.7257-27.1785-13.6016.png) | __ref27.wav(44)__mono_400-48.2511-24.0112-1.3164.png) | __ref28.wav(44)__mono_400-45.8735-20.9072-11.9667.png) | __ref29.wav(44)__mono_400-33.6738-26.9864-20.8416.png) | __ref30.wav(44)__mono_400-35.4187-26.0300-11.0466.png) | __ref31.wav(44)__mono_400-35.7714-25.7963-7.6269.png) | __ref32.wav(44)__mono_400-40.6954-21.1189-8.7912.png) | __ref33.wav(44)__mono_400-42.1350-34.5971-12.7581.png) | __ref34.wav(44)__mono_400-37.4281-25.2653-10.8367.png) | __ref35.wav(44)__mono_400-41.2061-27.8678-23.8213.png) |
| -30.1 | -25.1 | -25.5 | -33.2 | -26.6 | -26.7 | -32.1 | -24.3 | -24.1 | -23.6 | -26.8 | -22.6 | -21.9 | -27.8 | -35.8 | -25.9 | -27.9 | -25.2 | -33.2 | -37.9 | -31.6 | -23.6 | -24.6 | -21.7 | -27.3 | -27.2 | -24.0 | -20.9 | -27.0 | -26.0 | -25.8 | -21.1 | -34.6 | -25.3 | -27.9 |
2. Dendrogram of similarity of artifact signatures for the portable players.
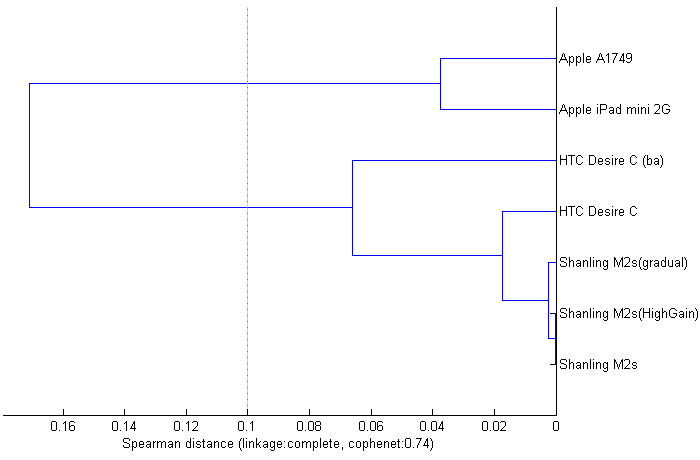 | Figure 7. Dendrogram showing similarity of artifact signatures of tested players. The shorter the link between two players, the more similar their artifact signatures. The Spearman distance = 0.1 is critical for relation of Df measurements to subjective scores. For those players which have similar artifact signatures (distance < 0.1) their perceived sound quality correlates well to df-measurements with substantial amount of real-life music material (histogram medians). |
The similarity dendrogramm is a bit misleading in this case (cophenetic coef. = 0.74). There should be a better instrument for visualization of non-euclidean distances between objects. Until then underlying matrix of distances will accompany each dendrogram (Table 1).
Table 1. Matrix of distances (Spearman) between artifact signatures of the players.
| | (1) (2) (3) (4) (5) (6) (7) |
 (1) Apple iPad mini 2
 (2) HTC Desire C
 (3) HTC Desire C (ba)
 (4) Shanling M2s
 (5) Shanling M2s (HighGain)
 (6) Shanling M2s (gradual)
(7) Apple A1749 adapter | 0 0.0619 0.0972 0.0445 0.0446 0.0334 0.0374
0.0619 0 0.0655 0.0149 0.0147 0.0174 0.1494
0.0972 0.0655 0 0.0651 0.0651 0.0660 0.1710
0.0445 0.0149 0.0651 0 0.0002 0.0024 0.1378
0.0446 0.0147 0.0651 0.0002 0 0.0025 0.1379
0.0334 0.0174 0.0660 0.0024 0.0025 0 0.1229
0.0374 0.1494 0.1710 0.1378 0.1379 0.1229 0 |
From the table, A1749 adapter can be safely compared to iPad mini 2 using df-measurements because they have similar artifact signatures (distance = 0.0374 < 0.1). Comparison of A1749 with other tested devices is questionable as their artifact signatures differ to greater extent (additional research needed).